User-generated content has moved from a nice-to-have into the default pre-purchase research layer for most online shoppers. Peer photos, short videos, and customer reviews now sit on more product pages, in more ads, and inside more email flows than at any point in the last decade.
The numbers behind the shift are striking. The UGC platform software market alone is on a projected path from $4.4 billion in 2022 to $32.6 billion by 2030, a 29.4% CAGR (Grand View Research). The creator economy that feeds it is on track to roughly double to $480 billion by 2027 (Goldman Sachs). And marketers are pouring more budget into the channel every year, with 87.49% of brands planning to increase influencer and creator spend in 2026 (Influencer Marketing Hub).
We pulled together 60+ current UGC statistics from primary reports (Grand View Research, Goldman Sachs, Nosto/Censuswide, DataReportal, Influencer Marketing Hub, Salsify, Allied Market Research, and widely cross-cited industry aggregators) and grouped them by topic so you can jump to the data you need.
Top User-Generated Content Statistics (Editor’s Picks)
- $4.4B to $32.6B: the UGC platform market is forecast to grow at a 29.4% CAGR through 2030.
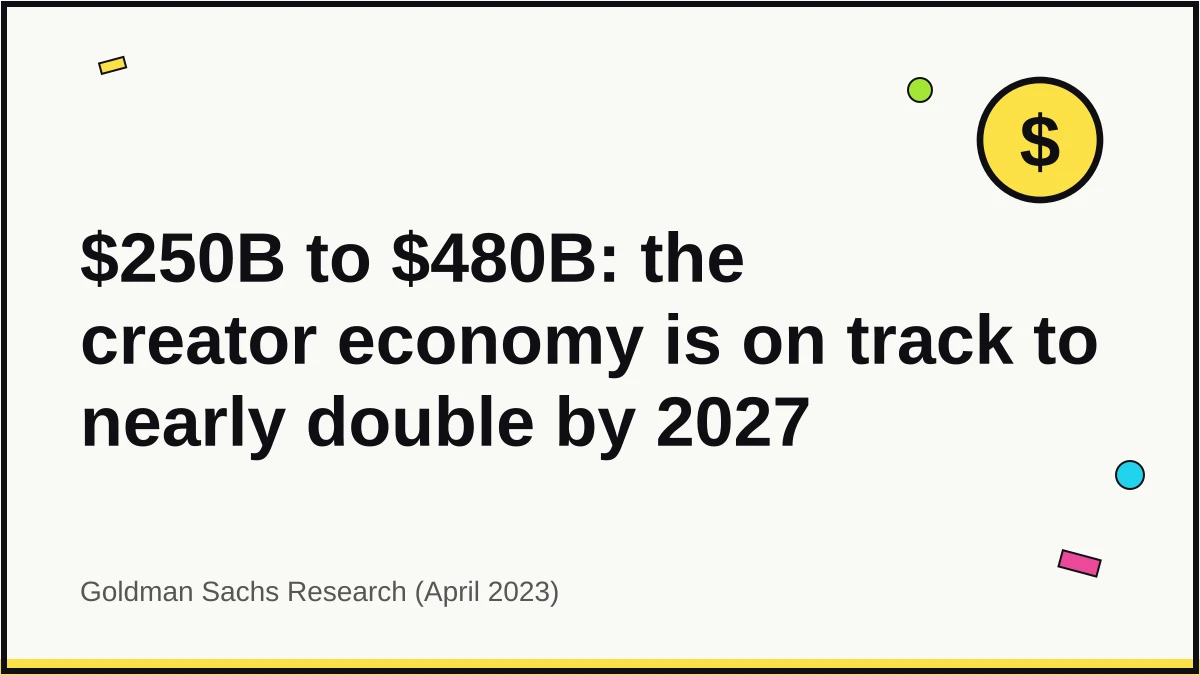
- $480 billion: the projected size of the global creator economy by 2027, up from roughly $250 billion in 2023.
- 50 million: global creators, expanding at a 10–20% compound annual growth rate.
- 87.49% of brands expect to increase their influencer and creator marketing budget in 2026.
- 5.24 billion people, or 63.9% of the world, are now active social media user identities.
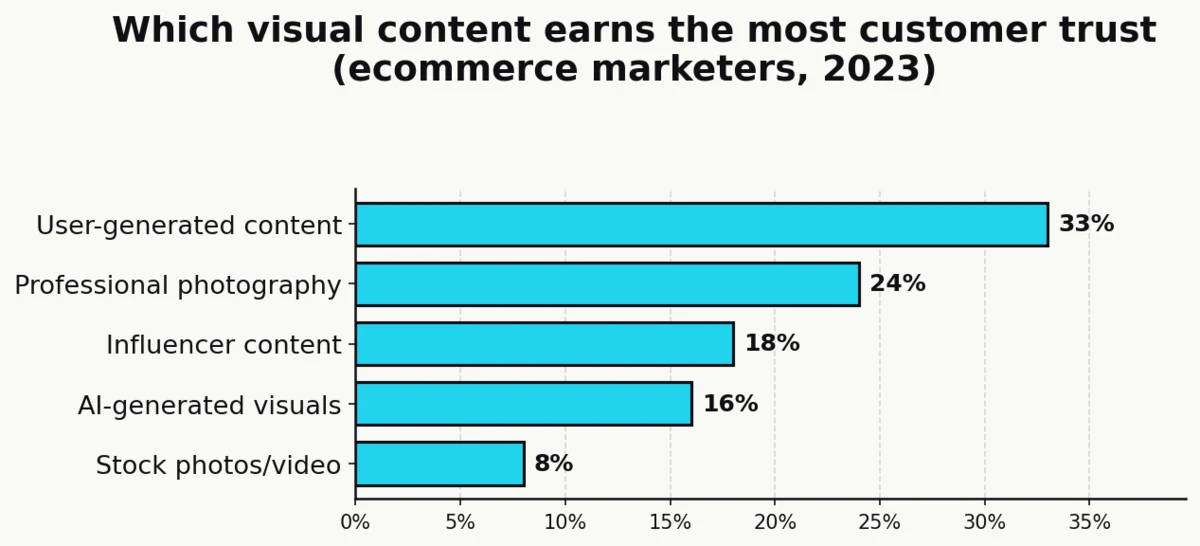
- 33% of ecommerce marketers say visual UGC produces the most customer trust, roughly twice the share who pick AI-generated visuals.
- 93% of marketers who use UGC say it performs significantly better than traditional branded content.
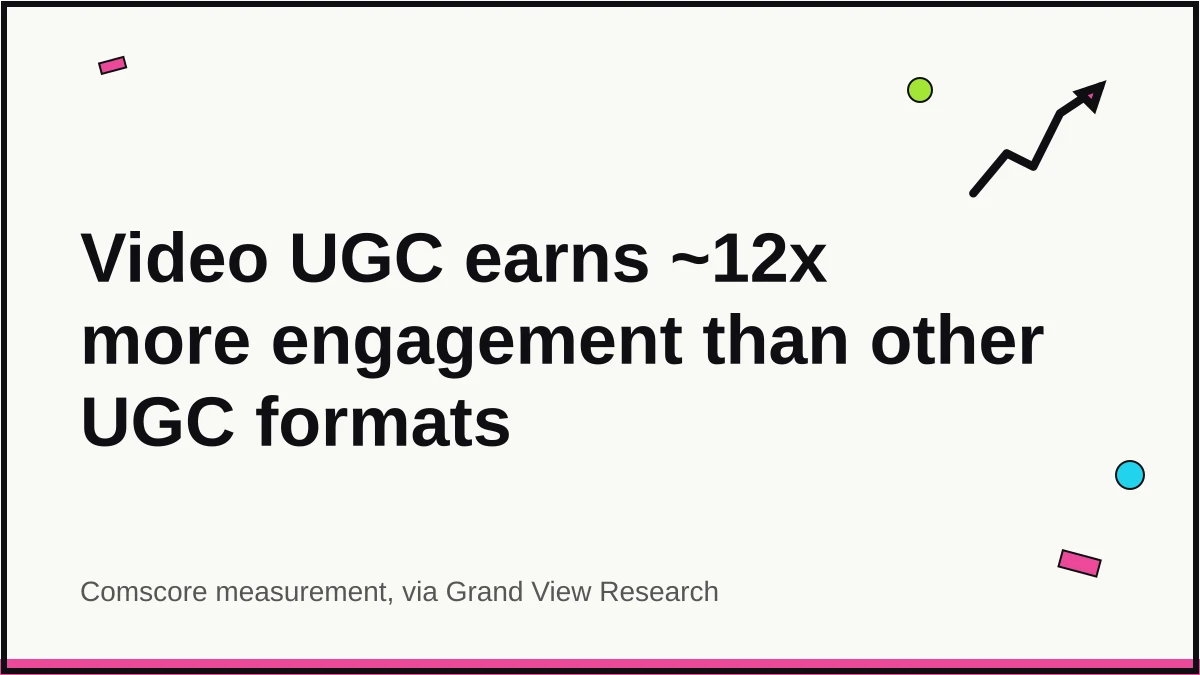
- 12x: video UGC earns about twelve times more engagement on social than other content forms.
- 80% of Gen Z consumers have shared a purchase on social media or say they would.
Consumer Trust and Authenticity
Trust is where UGC earns its keep. Consumers are drowning in brand messaging and filter hard on anything that feels staged. Peers, even complete strangers on the internet, outrank marketers on credibility across nearly every trust survey published in the last five years.
Visual UGC is the content type marketers most associate with customer trust, chosen by 33% of ecommerce marketers (Nosto)
In a Censuswide survey of 202 ecommerce marketers at brands with $50M+ in annual revenue, UGC topped every other visual format on perceived trust. Professional images and video came in at 24%, influencer-generated content at 18%, AI-generated visuals at 16%, and stock at 8%.
The gap between UGC and AI visuals is the interesting one. Marketers are roughly twice as likely to pick real customer content as the most trusted format, even as generative tooling has exploded across the same workflows.
| Visual content type | Share of marketers picking as “most trusted” |
|---|---|
| User-generated content | 33% |
| Professional photos/video | 24% |
| Influencer-generated | 18% |
| AI-generated | 16% |
| Stock photos/video | 8% |
Recommendations from friends and family are trusted by 92% of consumers more than any other form of advertising (Nielsen Global Trust in Advertising, via Billo)
The Nielsen Global Trust in Advertising baseline has held up for more than a decade across refreshes. It’s the single most cited figure in any conversation about peer credibility, and it frames why real-customer content consistently outperforms brand-produced creative in head-to-head tests.
84% of consumers trust brands more when they feature real customer content in their marketing (EnTribe)
EnTribe’s State of UGC consumer survey is reproduced widely across the industry. The headline trust lift pairs well with the generational breakdown later in this article, where it’s the 18–29 cohort driving the strongest UGC-led purchase behavior.
87% of brands say UGC is a more authentic way to show diversity than handpicking models and influencers (Nosto)
The same Nosto/Censuswide marketer survey surfaces a second authenticity signal. When the goal is to reflect a broader range of customers back to shoppers, brands see real user content as more credible than a cast of paid faces. In the same dataset, 87% of ecommerce marketers say it is now easier to launch and scale marketing campaigns using the large pool of high-quality visual UGC available to them.
Sources: Billo, EnTribe, Nosto
Purchase Influence and Conversion Impact
Trust converts. Product pages with UGC move stronger than those without, and shoppers are now willing to walk away from a purchase if there is nothing authentic to validate the claim.
UGC influences the purchase choices of 70% of Gen Z and 78% of Millennials (Billo)
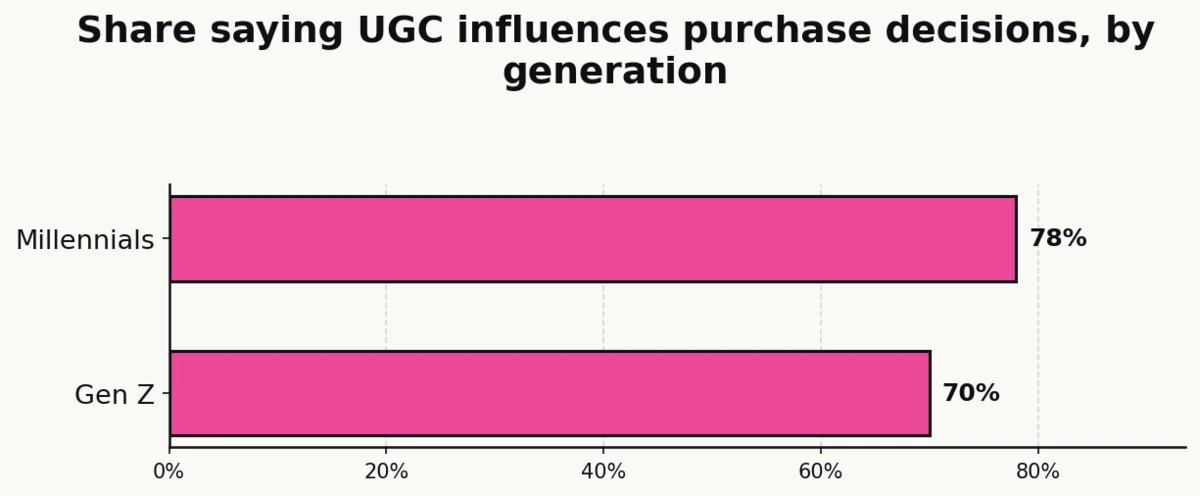
Both cohorts now treat UGC as a standard pre-purchase input, not a bonus signal. The gap between Millennials and Gen Z narrows as Gen Z ages into higher-spend categories.
62% of consumers are more likely to engage with marketing that includes real customers over brand-only creative (Billo)
The preference holds across ads, social posts, emails, and landing pages. Put a real person in the frame and engagement rises. The same dataset shows 77% of consumers report a higher tendency to buy products or services from brands that incorporate UGC into marketing.
65% of Americans say they rely on UGC when making purchasing decisions (Bazaarvoice SEI Vol. 18, via industry reporting)
Industry aggregators, citing Bazaarvoice’s paywalled 2024 Shopper Experience Index, put the share of U.S. shoppers who rely on UGC at roughly two-thirds. The figure is consistent with the conversion and revenue-per-visitor lifts reported across the same research series, and with the Gen Z / Millennial reliance data above.
Roughly 1 in 8 shoppers (13%) will abandon a purchase entirely if no UGC is available on the product page (Salsify 2024 Consumer Research Report, via industry reporting)
Industry aggregators, citing Salsify’s 2024 Consumer Research Report, frame this as a hard abandonment behavior, not a hesitation. For a category with thin UGC coverage, that translates directly into lost revenue before the cart page even loads. In the same report, 49% of shoppers say their preferred shopping mode is a mix of online and in-store, a structure that leans heavily on trustworthy PDP content.
Sources: Billo, Salsify, Bazaarvoice
Marketer Adoption and ROI
Marketers noticed. Adoption is near-universal at the tactic level, yet the operational gap between using UGC and running it as a dedicated program remains wide.
93% of marketers who use UGC say it performs significantly better than traditional branded content (Billo, citing Forbes Tech Council)
The 93% figure is the most quoted adoption-and-performance number in the space. Forbes Tech Council first surfaced it and it has since been reproduced across Billo, Podium, and a dozen vendor aggregators.
86% of brands and retailers believe authentic user content significantly improves ad performance (Bazaarvoice via Billo)
The adoption story pairs with the ad-performance story. Brands aren’t just using UGC because it’s cheap to produce. They’re using it because the creative performs better on the same platforms and placements where their branded creative already lives.
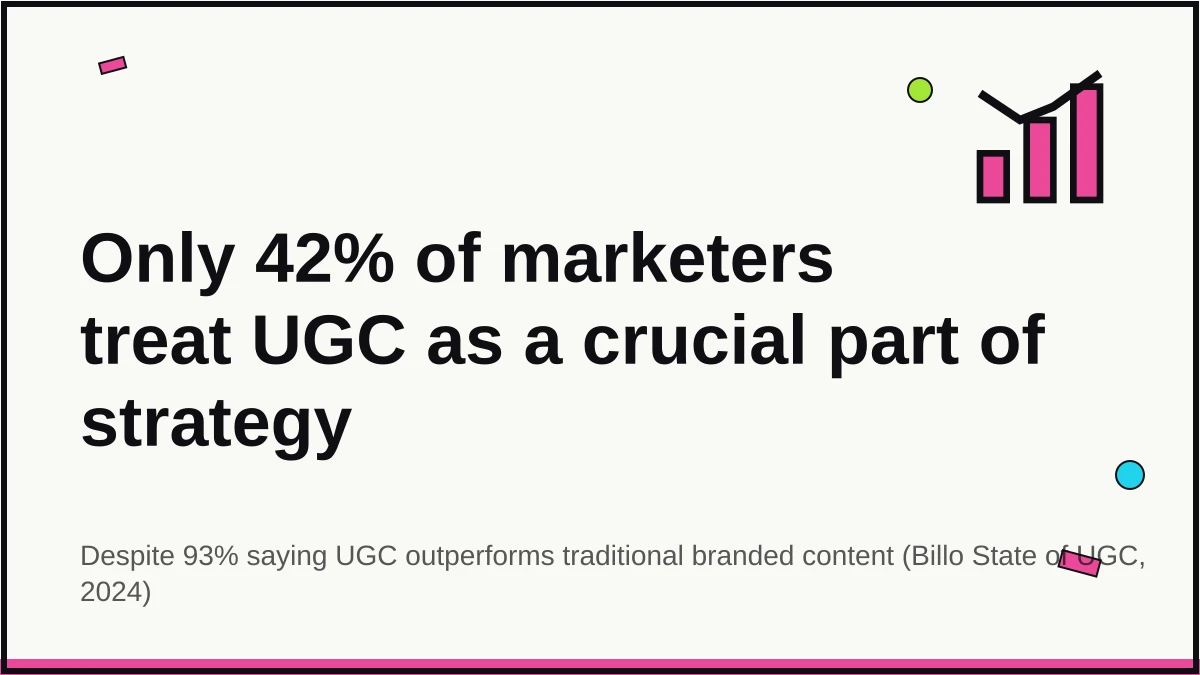
Only 42% of marketers treat UGC as a crucial element of their strategy (Billo)
The gap between tactical usage and strategic commitment is the opportunity. Even with near-universal usage of UGC across marketing mixes, less than half of marketers have built the rights management, incentive, and distribution infrastructure required to run it as a dedicated program.
81% of ecommerce marketers say visual UGC resonates more with customers than professionally shot or influencer content (Nosto)
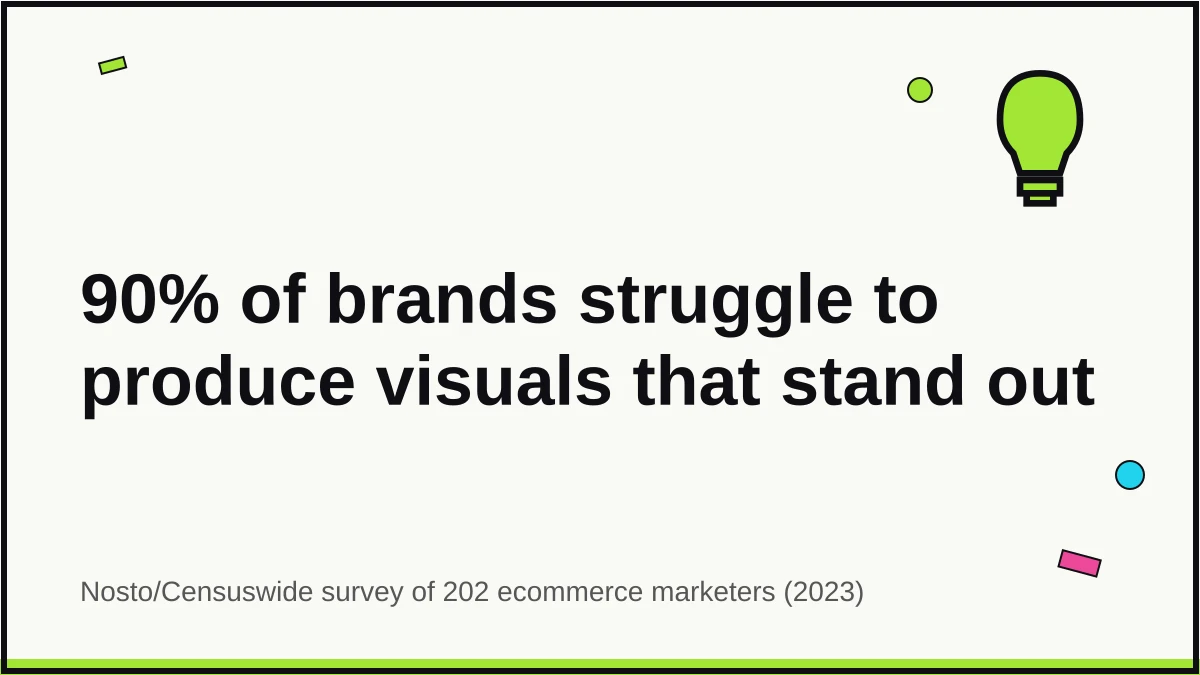
In the Nosto/Censuswide marketer survey, the resonance gap shows up across fashion, beauty, home, electronics, and food/drink verticals. In the same dataset, 85% of marketers say visual UGC minimizes cost compared with professional photography or influencer content, and per industry aggregators reporting on the Nosto study, 90% admit they struggle to generate visuals that stand out from competitors — a gap UGC is filling in practice.
50% of marketers use UGC in email marketing, where it is associated with 78% higher click-through rates (Billo)
Email is the quiet UGC channel. The click-lift figure is widely cited but should be read as directional: the exact methodology behind the 78% number is not public in the primary reporting.
Social Media and Platform Performance
Platform behavior diverges. Instagram still leads for marketer-perceived engagement, TikTok has locked down the short-form-video narrative, and creators now spread work across a wider portfolio of channels than they did two years ago.
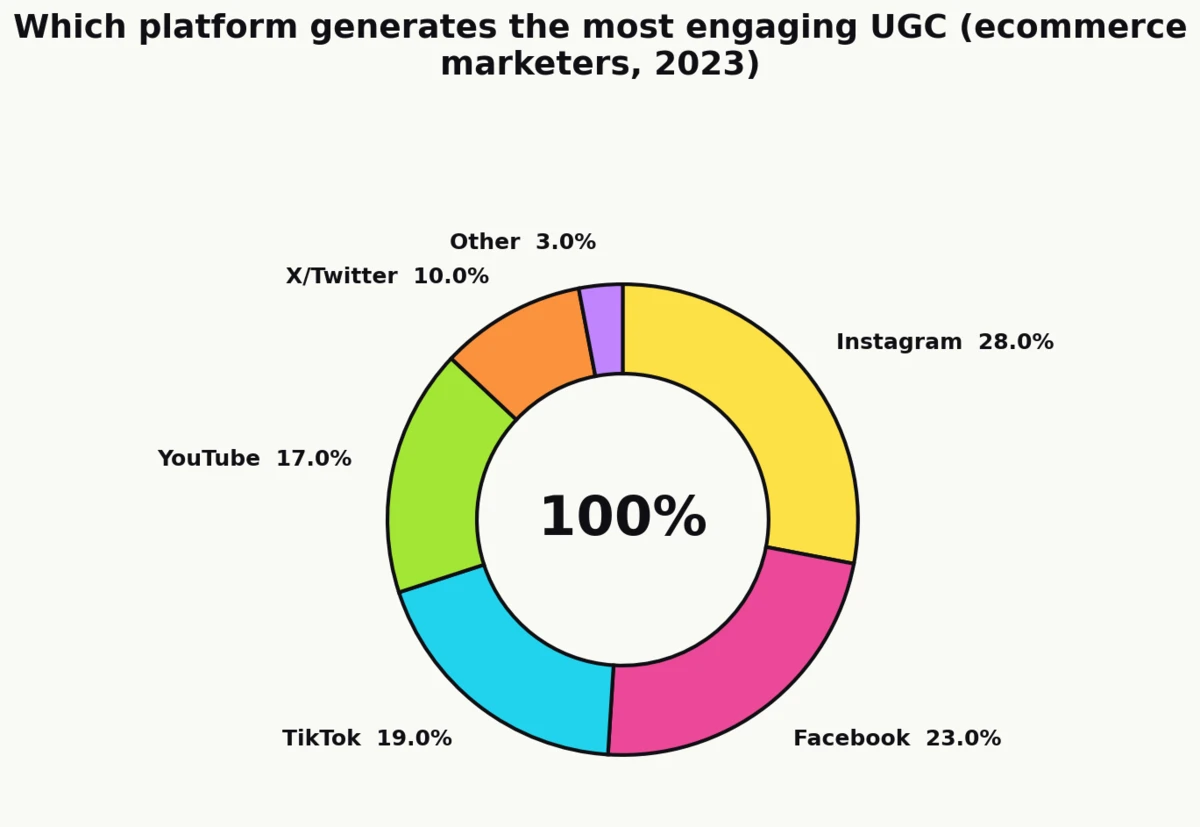
28% of ecommerce marketers say Instagram produces the most engaging UGC, followed by Facebook at 23%, TikTok at 19%, YouTube at 17%, and X/Twitter at 10% (Nosto)
Instagram’s lead is narrowing but still real. The story behind the numbers is that most marketers maintain accounts on at least three of these platforms and allocate UGC to the one where their audience concentrates, not to the one with the best platform-level engagement average.
| Platform | Share of marketers picking as most engaging for UGC |
|---|---|
| 28% | |
| 23% | |
| TikTok | 19% |
| YouTube | 17% |
| X/Twitter | 10% |
| Other / none | 3% |
UGC-based ads generate 73% more positive comments than brand-produced ads on the same platforms (Billo)
Comment sentiment is the underrated lift. The 73% figure turns on the social-proof flywheel: real customers are more likely to be tagged, asked questions, and recommended to friends in comment threads than brand-produced creative.
UGC posts earn 28% higher engagement on social networks than traditional brand content (Billo)
Organic engagement rates on UGC posts consistently outperform branded posts in matched benchmarks, even before paid amplification. This is the headline number most often repeated in creative-ops decks as the case for shifting the visual mix toward customer content.
TikTok users report being 58% more likely to trust UGC on the platform than on other social media (TikTok for Business Marketing Science, via industry reporting)
The TikTok number is sourced from a TikTok-commissioned authenticity study. Treat it as platform-funded research, useful for directional framing rather than as an independent benchmark.
The average social media user now spends 2 hours 21 minutes per day on social platforms, across a global base of 5.24 billion user identities (DataReportal)
Kepios’ January 2025 digital overview puts daily social time at 2h 21m and the global social user identity base at 5.24 billion, or 63.9% of the world. For context, adult internet users spend an average of 6 hours 38 minutes online each day, meaning social media captures more than a third of all time online for the average user.
Sources: Billo, DataReportal, Nosto
UGC by Generation and Demographic
Not every cohort treats UGC the same way. Younger shoppers expect it as the default content layer. Older shoppers consult it for specific categories. Both groups are now shopping across channels in ways that make on-page UGC more important, not less.
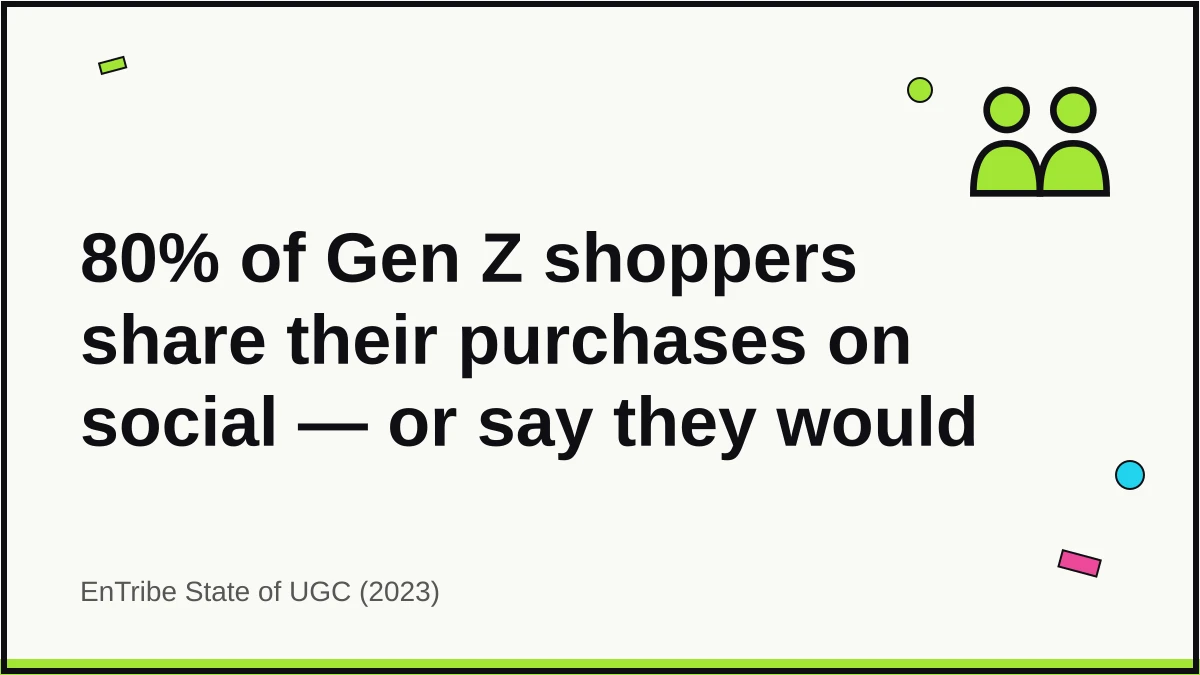
80% of Gen Z consumers have either shared a purchase on social media or say they would (EnTribe)
The share-purchase behavior is the structural reason UGC keeps compounding. A cohort that routinely posts about what it buys becomes the supply side of the UGC content pipeline for the next cohort’s buying decisions.
78% of Millennials say UGC is very helpful in the buying process (Billo)
Millennials, now firmly in their peak earning years, continue to cite UGC as the most helpful content layer in the buying process. The helpfulness metric is a better leading indicator of spend shift than raw trust percentages.
70% of Gen Z find UGC very helpful in buying decisions (Billo)
Gen Z’s helpfulness rating sits roughly eight points below Millennials’ but the gap has been closing in every recent refresh. For categories with high visual decision cost (fashion, beauty, home), Gen Z weighting of UGC over branded imagery is the dominant pattern.
Generational omnichannel preference: 46% of Boomers, 47% of Gen X, 51% of Gen Z, and 53% of Millennials want a mix of online and in-store shopping (Salsify)
The omnichannel split is tighter than most generational data suggests. Every cohort has a near-majority preference for a mix of online and in-store, which is precisely the context in which product-page UGC does the most work.
Sources: Billo, EnTribe, Salsify
Creator Economy and Market Size
The commercial infrastructure behind UGC is expanding quickly. Platform software revenue, creator spend, and the number of paying brand relationships are all on hockey-stick trajectories.
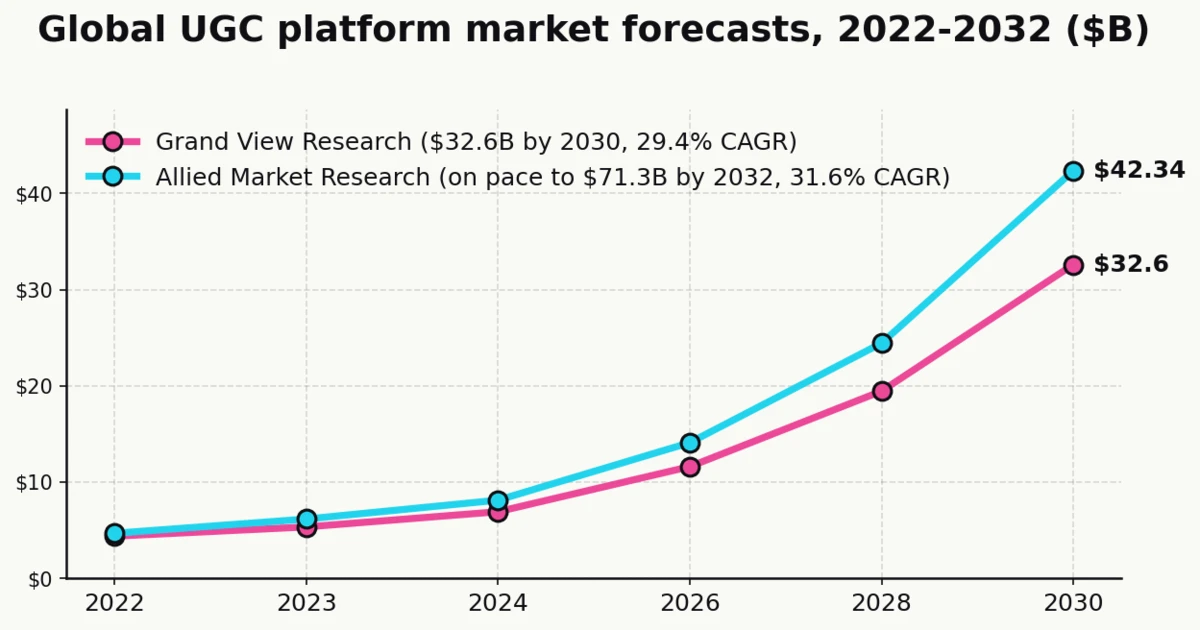
The UGC platform market is projected to grow from $4.4 billion in 2022 to $32.6 billion by 2030, a 29.4% CAGR (Grand View Research)
Grand View Research’s base-year 2022 forecast puts the 2023 market at $5.36 billion and the 2030 endpoint at $32.6 billion. North America held 34.1% of the market in 2022, audio and video content types accounted for 33.7% of revenue, and the enterprise segment captured 63.1% of spend.
| Year | UGC platform market size (GVR forecast) |
|---|---|
| 2022 | $4.4B |
| 2023 | $5.36B |
| 2030 | $32.6B |
An alternate market-sizing pegs the UGC platform market at $4.7B in 2022 rising to $71.3B by 2032, a 31.6% CAGR (Allied Market Research)
Allied Market Research’s longer forecast horizon pushes the 2032 endpoint well above Grand View’s. The two forecasts differ on terminal value but agree on the shape of the curve: double-digit compound growth sustained across the decade.
The global creator economy is on pace to reach $480 billion by 2027, up from roughly $250 billion in 2023 (Goldman Sachs)
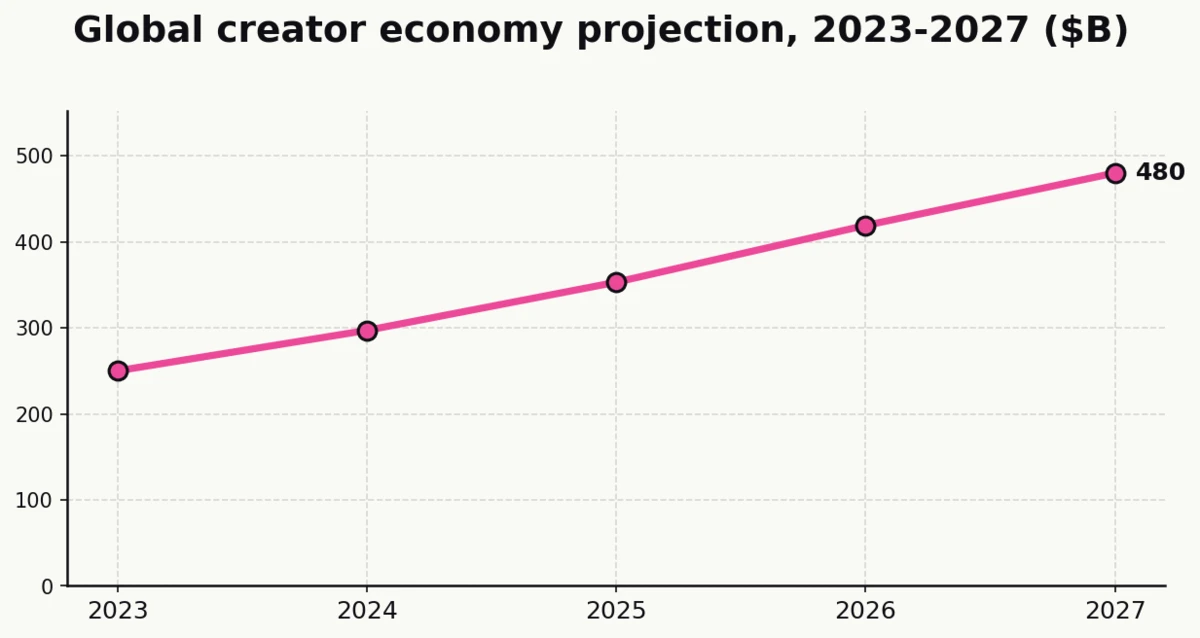
Goldman Sachs’ Eric Sheridan team sized the total addressable creator economy at $250B in 2023 and projected a near-doubling by 2027. The report frames the trajectory as structurally supported by ad spend shifting from linear channels to creator-led formats.
Goldman Sachs estimates 50 million global creators, expanding at a 10–20% compound annual growth rate (Goldman Sachs)
The pool of global creators is still expanding faster than the pool of creator-marketing budgets, which is part of why average rates paid to individual creators have not risen as quickly as total category spend. Only about 4% of creators globally are professionals pulling in more than $100,000 per year.
Brand deals make up roughly 70% of creator revenue, according to Goldman Sachs survey data (Goldman Sachs)
The 70% brand-deal share is the single most important operating stat for anyone sizing a UGC program. Creators earn most of their income from direct brand partnerships, with ad-revenue share, subscriptions, and direct-payment tips making up the balance.
Sources: Allied Market Research, Goldman Sachs, Grand View Research
Influencer and Creator Marketing Investment (2026)
Budget intent heading into 2026 is the cleanest leading indicator of where UGC is going. The Influencer Marketing Hub 2026 Benchmark Report surveys marketing teams on spend, structure, and measurement.
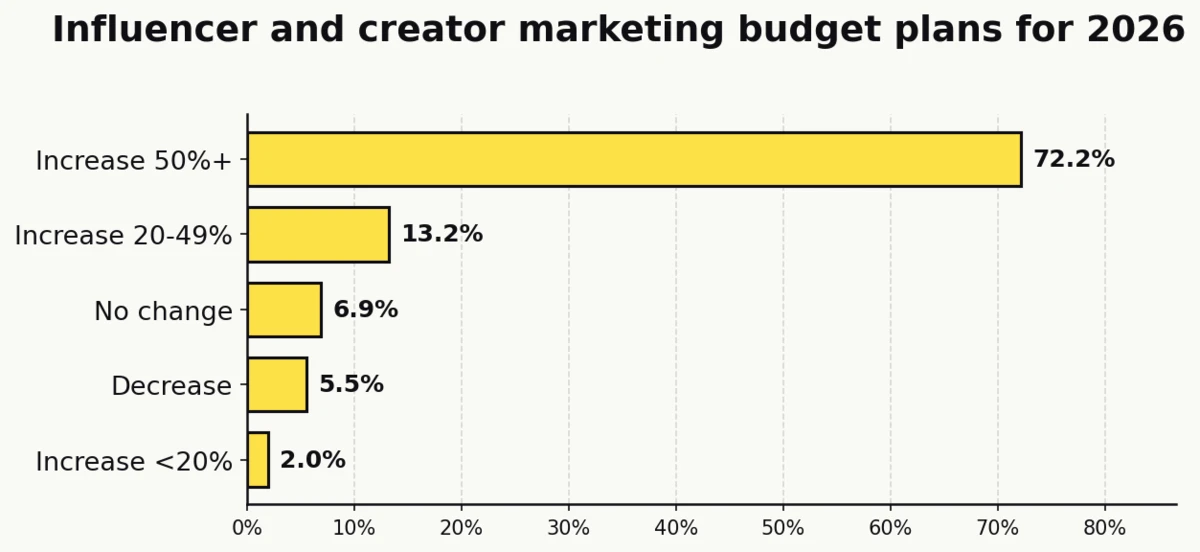
87.49% of brands expect their influencer and creator marketing budget to increase in 2026, and 72.22% plan increases of 50% or more (Influencer Marketing Hub)
The spending intent is lopsided. Only 5.55% of respondents expect their budget to decrease. The share planning large (50%+) increases is the structural signal: this is not incremental growth, it is a category re-rating.
31% of brands select TikTok as their primary influencer platform in 2026 (Influencer Marketing Hub)
TikTok is the single most picked platform for 2026 influencer investment. It also polarizes: among brands testing influencer marketing for the first time, TikTok is the top choice at 31%, but among brands decreasing spend, TikTok is also the top platform to cut at 39%. The divergence reflects a maturing category where winners and losers are becoming visible.
66.3% of brands now run their influencer programs entirely in-house (Influencer Marketing Hub)
The shift toward in-house programs is the operational counterpart to the budget story. Brands running real money through creator partnerships are bringing the capability inside rather than outsourcing to agencies or networks.
55.1% of marketers name brand awareness as their top influencer-marketing KPI (Influencer Marketing Hub)
Brand awareness is the most-picked KPI, followed by UGC generation and revenue/sales. The primacy of awareness is notable because it sits upstream of conversion outcomes and reflects marketers treating creator content as a top-of-funnel reach layer, not just a performance channel.
65.9% of marketers expect payback within one month, including 48.4% within two weeks (Influencer Marketing Hub)
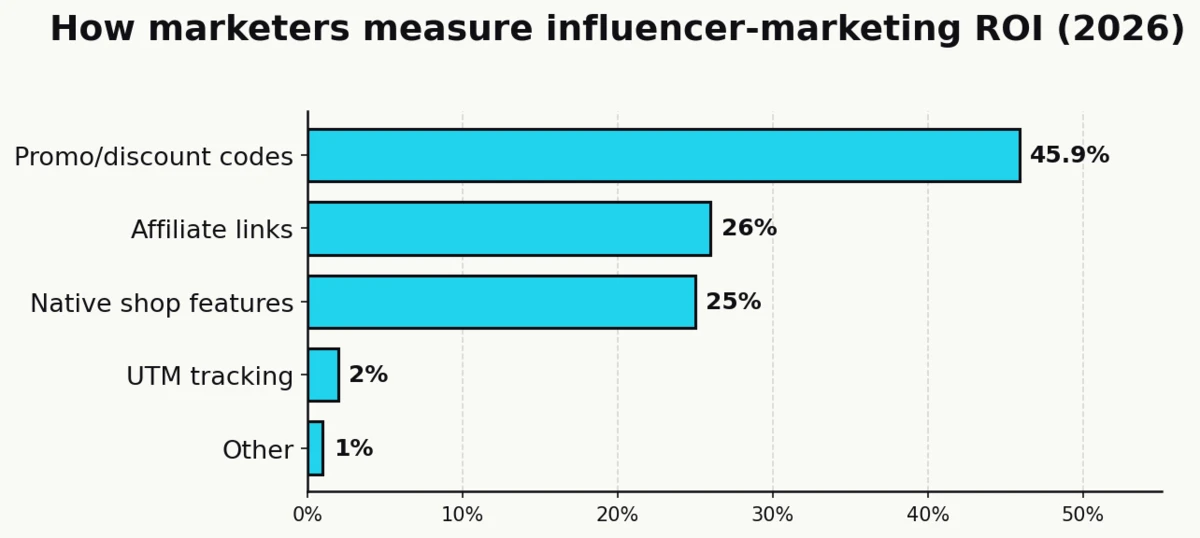
The payback-window expectation is unusually aggressive. It assumes creator content is priced and measured like performance media, with discount codes leading the measurement tool mix at 45.9%, affiliate links at 26%, and native shop features at 25%.
Sources: Influencer Marketing Hub
Video UGC, AI, and Emerging Trends
Short-form video has become the default UGC format. AI-generated content is entering the stack alongside real user content, and the trust gap between the two is still significant.
Video UGC gets approximately 12x more engagement on social media than other user-generated content types (Grand View Research)
The 12x multiplier, sourced from Comscore measurement referenced inside the Grand View market report, is the single most important content-format stat for brands planning 2026 creative mixes. Video is not marginally better. It is an order-of-magnitude better on engagement.
92% of users say they are likely to share videos they watch on social media (Grand View Research)
Shareability is the other side of the video coin. The content does not just outperform at the post level, it carries further through networks of friends and followers.
Paid content combined with UGC has been shown to boost conversion rate by 28% (Comscore, via Grand View Research)
Amplifying UGC through paid creative is the cleanest compounding play in the category. Organic UGC earns higher engagement, and paired with paid distribution it converts 28% higher than paid campaigns without a UGC creative base.
Only 10.56% of influencer-marketing teams report “not using AI” in their workflow (Influencer Marketing Hub)
AI has quietly become universal in creator operations. The top use case is creator discovery, followed by creative variation and caption testing. The AI question has flipped from “will marketers adopt” to “how will the trust gap play out on the content AI produces.”
Visual UGC is picked as the most-trusted content type by 33% of marketers, versus 16% for AI-generated visuals, the largest gap between any two content formats in the Nosto/Censuswide survey (Nosto)
The authenticity premium on real customer content over AI is the single most important insight for brands building 2026 creative mixes. Generative tools speed up production, but they do not close the trust gap against real peers.
Sources: Grand View Research, Influencer Marketing Hub, Nosto
Key Takeaways
UGC has crossed from adjunct to anchor. Consumer reliance on peer-produced content is now near-universal for pre-purchase research, and the brands that resist risk losing both trust and revenue per visitor. The single most citable headline number for 2026 is the 29.4% CAGR on the UGC platform market, which stays in the same range across every independent forecast and tracks closely to the near-doubling of the creator economy to $480 billion by 2027.
Three patterns in the data are worth surfacing. First, the adoption gap is the opportunity. 93% of marketers say UGC outperforms branded content, but less than half treat it as a crucial strategic element. The moat is operational, built from rights management, incentives, and distribution infrastructure, not from creative ideation. Second, the AI trust gap is not closing. Marketers trust real customer content at roughly twice the rate of AI-generated visuals, and the gap has held steady even as generative tools have spread across the workflow. Third, video is the format that compounds. A 12x engagement multiplier on video UGC, combined with 87% of brands pushing influencer and creator budgets higher in 2026, means short-form video is where most of the new creator spend is going.
For operators and marketers, the implication is that the content pipeline matters as much as the distribution layer. The brands winning in 2026 will be the ones that have sourced enough real customer content to keep product pages, ad creative, and email flows saturated with peer-made visuals. The rest will keep relying on branded creative that a growing majority of their shoppers already treat as the less-trusted option.
Sources
- Allied Market Research (2023). “User Generated Content Platform Market.” https://www.alliedmarketresearch.com/user-generated-content-platform-market
- Bazaarvoice (2024). “Shopper Experience Index Volume 18.” https://www.bazaarvoice.com/resources/shopper-experience-index-volume-18/
- Billo (2024). “UGC Statistics.” https://billo.app/blog/ugc-statistics/
- DataReportal (2025). “Digital 2025 Global Overview Report.” https://datareportal.com/reports/digital-2025-global-overview-report
- EnTribe (2023). “The State of UGC.” https://www.entribe.com/resource/the-state-of-ugc-2023
- Goldman Sachs (2023). “The Creator Economy Could Approach Half-a-Trillion Dollars by 2027.” https://www.goldmansachs.com/insights/articles/the-creator-economy-could-approach-half-a-trillion-dollars-by-2027
- Grand View Research (2023). “User Generated Content Platform Market Size Report.” https://www.grandviewresearch.com/industry-analysis/user-generated-content-platform-market-report
- Influencer Marketing Hub (2026). “Influencer Marketing Benchmark Report.” https://influencermarketinghub.com/influencer-marketing-benchmark-report/
- Nosto (2023). “New Research: Brands Prefer UGC for Diversity (Censuswide survey of 202 ecommerce marketers).” https://www.nosto.com/blog/new-research-brands-prefer-ugc-for-diversity/
- Salsify (2024). “2024 Consumer Research Report.” https://www.salsify.com/resources/report/2024-consumer-research-report