Event marketing has crossed from recovery into expansion. A majority of organizers now say in-person conferences are their single most impactful marketing channel, and Allied Market Research projects the global events industry to reach $2.5 trillion by 2035.
The story underneath that headline is uneven. Budgets for roughly four in ten programs are growing in 2026, another four in ten are holding flat, and only one in five is contracting. Teams are smaller than the budgets suggest. Nearly half of event organizations operate with just one to three people, and the measurement gap that defined 2022 has closed by 30 points in a single year.
Below are the verified 2026 event marketing statistics, covering market size, budget direction, ROI, format mix, technology adoption, AI deployment, and attendee behavior. The numbers come from primary research by Bizzabo, Splash, Allied Market Research, and the Center for Exhibition Industry Research (CEIR) with Oxford Economics.
Top 7 Event Marketing Statistics (Editor’s Picks)
- $2.5 trillion is the projected size of the global events industry by 2035, a 6.8% CAGR from its 2026 base.
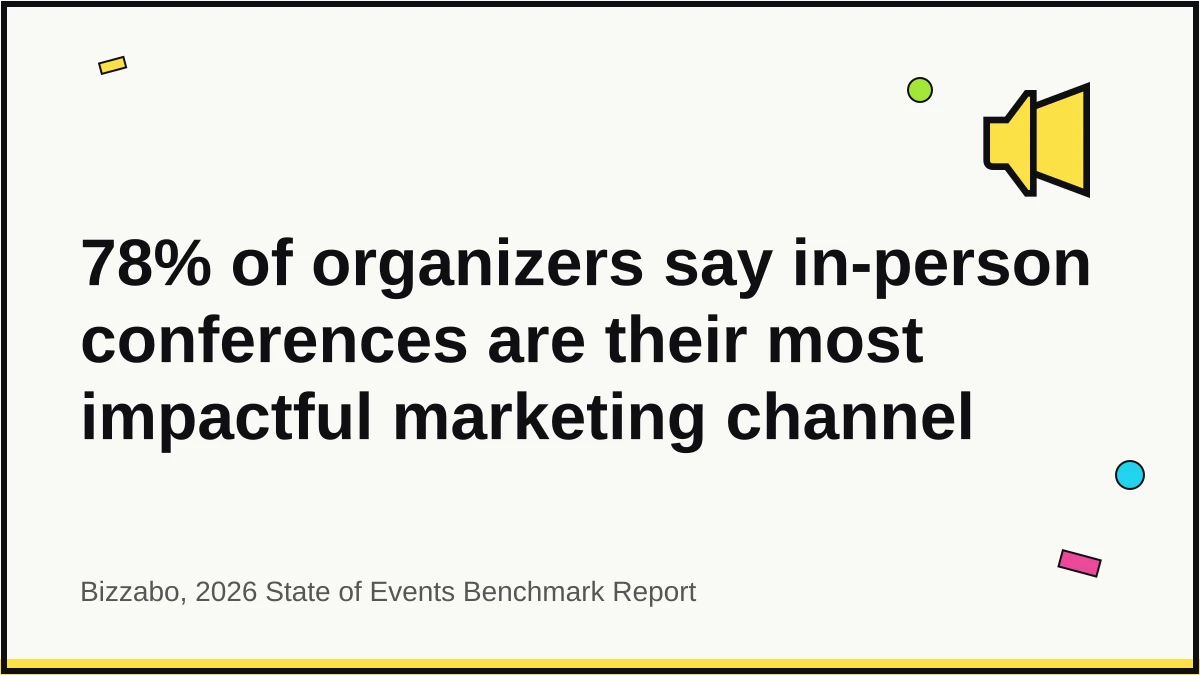
- 78% of organizers say in-person conferences, summits, and conventions are their organization’s most impactful marketing channel.
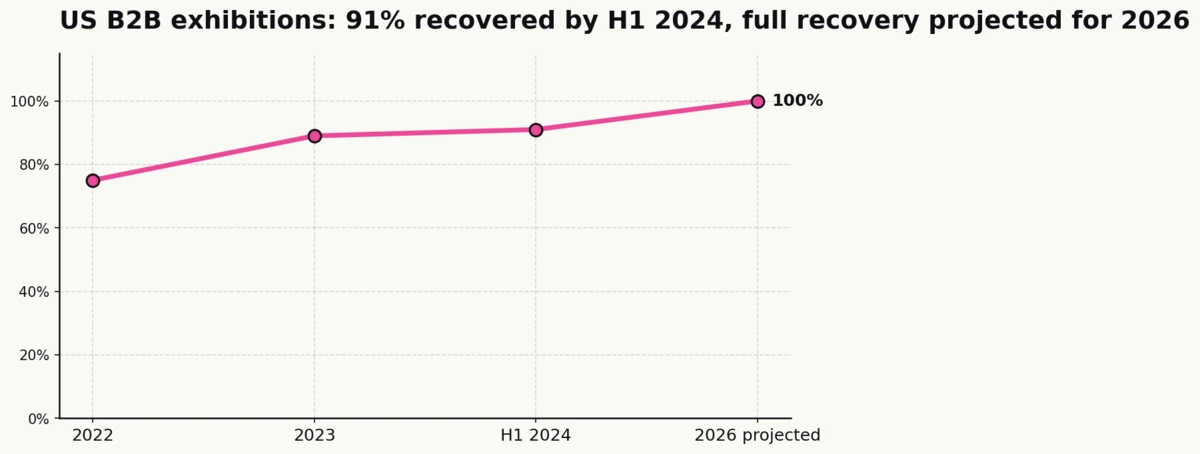
- 91% of pre-pandemic exhibition industry levels were reached in H1 2024, with full recovery forecast by 2026.
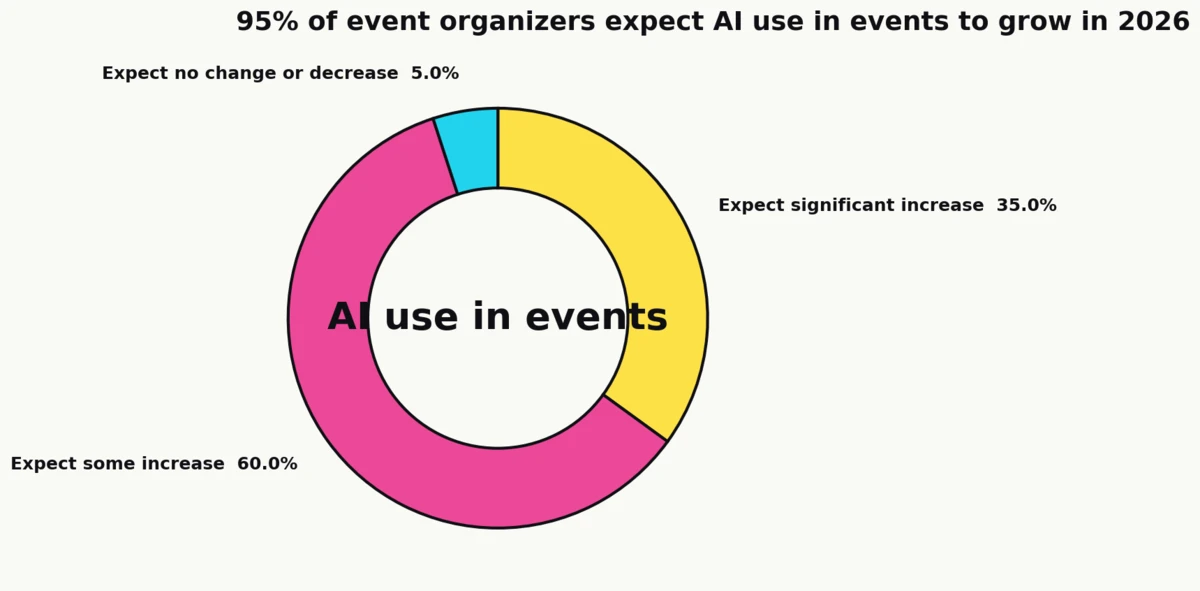
- 95% of event organizers expect their organization’s use of AI in events to increase in 2026.
- 40% of organizers still report difficulty proving event ROI, down sharply from 70% the year prior.
- 79% of organizers have their event platform integrated with CRM or marketing automation.
- 63% / 33% / 4% is the in-person, virtual, and hybrid format split observed on one major event platform in 2026.
Event Industry Market Size and Growth
Event marketing stopped being a recovery story sometime in 2024 and became a growth story. Every major market-sizing firm now sees the category compounding at a meaningful CAGR through the end of the decade, with the exhibition and conference sub-segments leading the rebound. The strategic question marketers are answering in 2026 is no longer whether events will be funded, but which formats earn the marginal dollar.
The global events industry was valued at $736.8 billion in 2021 and is projected to reach $2.5 trillion by 2035 (Allied Market Research)
Allied Market Research’s industry outlook puts the category’s compound annual growth rate at 6.8% across the 2026–2035 window, segmented by event type (business, music, sports, festival), format, revenue source, and end-user vertical.
The 6.8% headline figure is conservative relative to the fastest-growing sub-segments. Corporate events and B2B conferences are tracking closer to double-digit CAGRs in the independent research reviewed for this piece, and the exhibition category is pulling category-wide growth upward as post-pandemic demand normalizes.
The US B2B exhibition industry reached 91% of pre-pandemic levels in H1 2024, on track for full recovery by 2026 (CEIR / TSNN)
CEIR’s Total Index (a composite of attendance, net square feet, exhibitor count, and revenue) hit 91% of pre-pandemic performance in the first half of 2024, up from 89% for full-year 2023 and 75% in 2022. Oxford Economics, CEIR’s analytical partner, forecasts “continued incremental growth toward full recovery by 2026.”
| Period | CEIR Total Index (% of pre-pandemic) |
|---|---|
| 2022 | 75% |
| 2023 | 89% |
| H1 2024 | 91% |
| 2026 (forecast) | ~100% |
That trajectory is significant because the exhibition line is historically the least elastic part of the category. When trade shows are recovering at this pace, downstream categories (corporate events, user conferences, brand activations) typically follow.
High-performing event organizations run an average of 25 events per year (Bizzabo)
Anonymized platform data from Bizzabo’s mature, multi-event customer cohort puts the average at 25 events per year for the high-performing segment. That number reflects an enterprise B2B panel, not small-business or consumer-festival organizers, so it serves as an upper-bound benchmark for what a fully resourced program looks like.
Read alongside the market-size forecast, the frequency benchmark tells operators that the competitive bar for 2026 is a calendar of recurring, smaller events, not one-off flagships.
Sources: Allied Market Research, CEIR / TSNN, Bizzabo
Event Marketing Budgets and Team Resources
Event budgets now compete directly with paid media for marginal dollars. The strategic shift is away from one-off flagship events and toward portfolios of smaller, repeatable, measurable formats. Budget growth is uneven across the market: large-enterprise programs are scaling up, mid-market teams are holding flat, and the teams inside those programs are smaller than headline spend suggests.
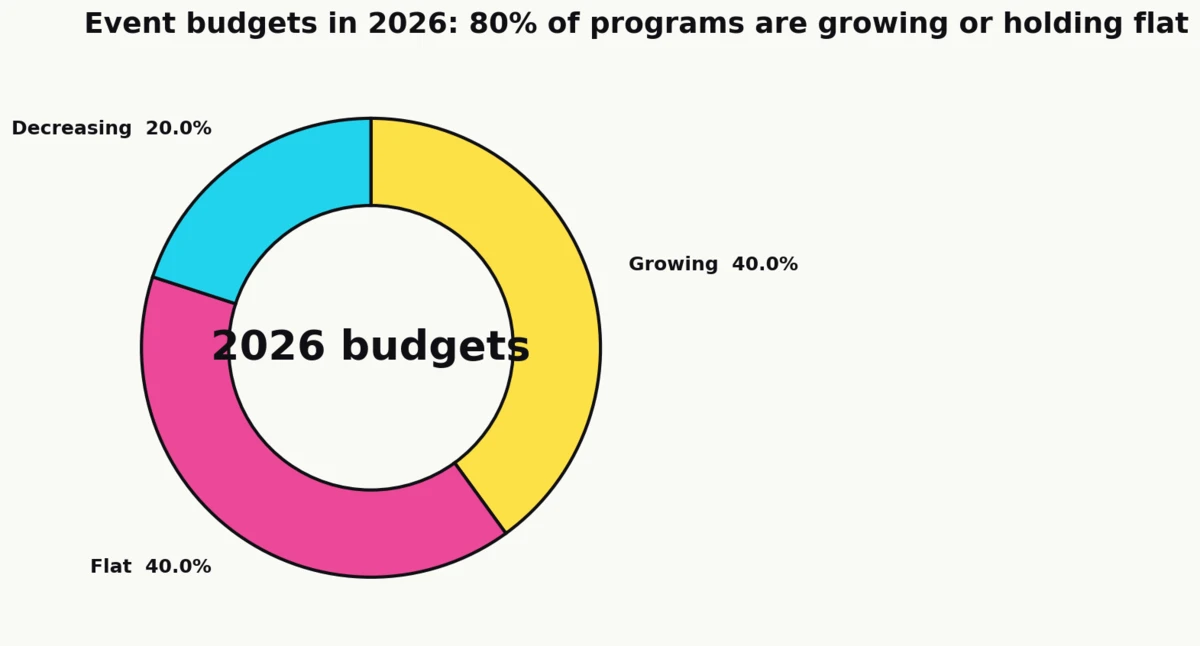
40% of organizers expect their event budget to grow in 2026, 40% expect it to stay flat, and 20% expect a decrease (Bizzabo State of Events 2026)
The 40/40/20 split is notable because it overturns the common framing that event budgets are uniformly rising. 80% of organizers are either growing or maintaining spend, but the distribution of growth is concentrated at the top of the market. Bizzabo’s own framing is that 2026 is “the optimization era of events,” where the marginal dollar goes to measurement, experience design, and integration rather than raw event volume.
40% of organizers plan to host more events in 2026, another 40% will maintain current volume (Bizzabo)
Event volume tracks budget direction almost exactly. Combined with the budget data, that means 80% of programs are either scaling up or holding steady on cadence, with only a fifth pulling back. For operators, the headline is that the total number of B2B events in 2026 will be flat-to-up, not down, regardless of the macro sentiment.
45% of event teams operate with just 1 to 3 people (Bizzabo)
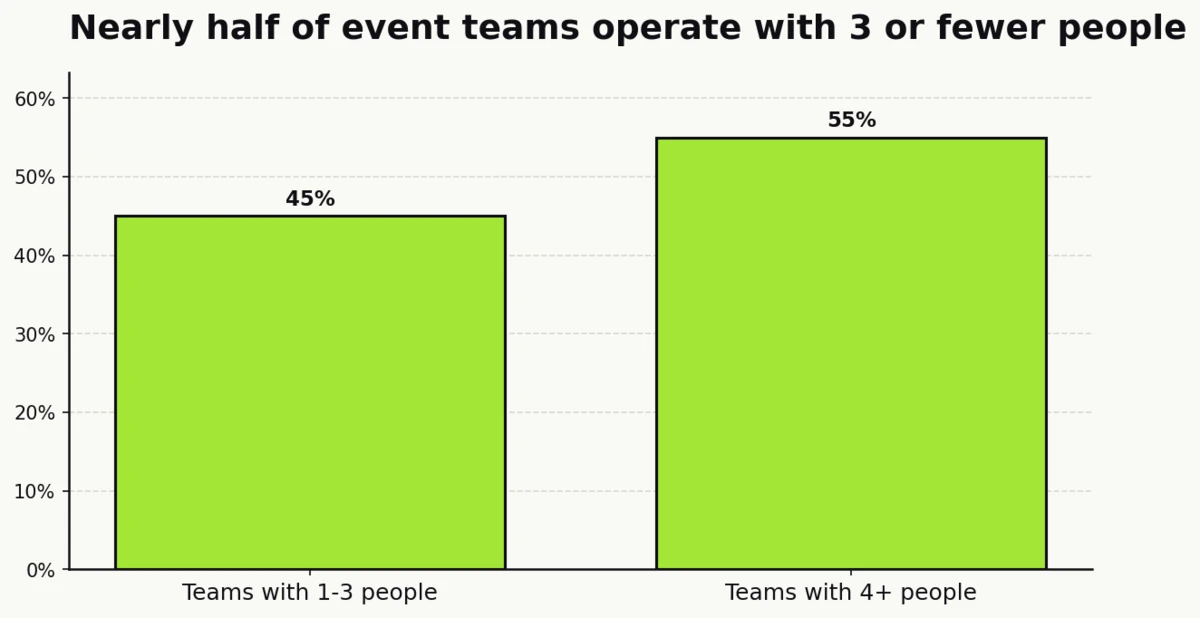
Nearly half of event organizations are running on skeleton crews. The implication for procurement is that the wedge between budget and team size keeps growing. Lean teams buy tooling; well-staffed teams build in-house.
Sources: Bizzabo
Event ROI and Revenue Attribution
The long-running complaint that event marketing cannot be measured is giving way to a more honest statement: it can be measured, just not with the tooling most teams had in 2022. In 2026, ROI confidence rises in direct proportion to CRM integration and the use of a documented attribution model. The single biggest predictor of reported ROI is whether event data flows into the same system of record as paid media.
40% of organizers still report difficulty proving event ROI, down from 70% in 2025 (Bizzabo State of Events 2026)
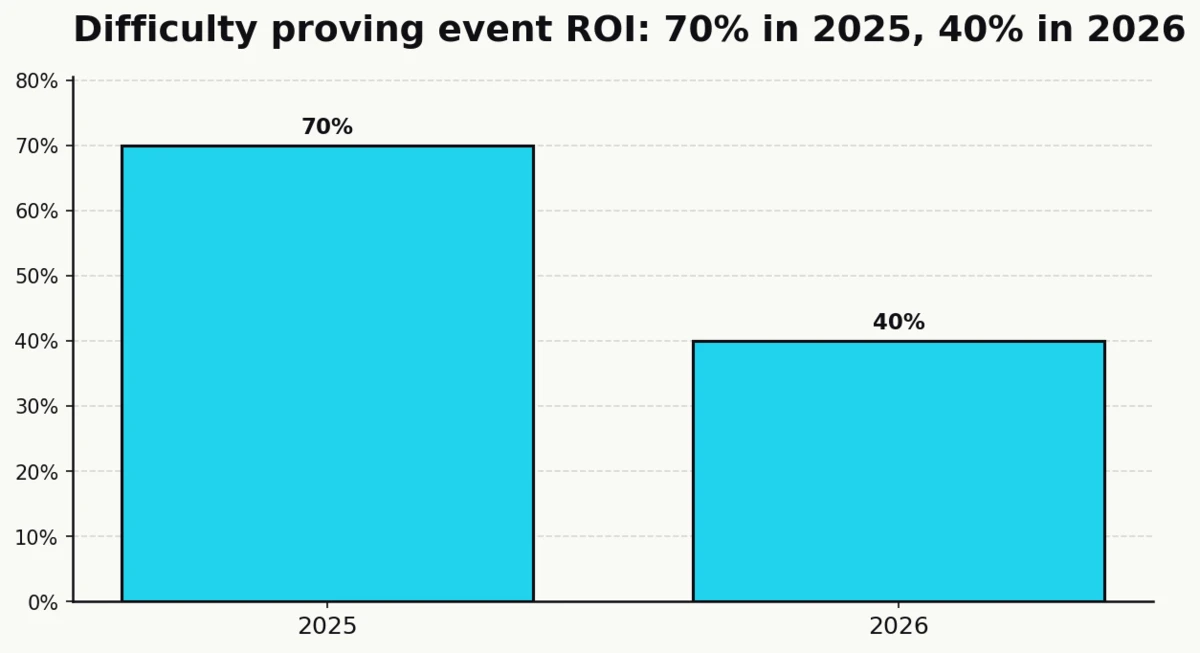
The 30-point drop in a single year is the most consequential measurement finding in the 2026 data. Bizzabo’s 2025 report documented 70% of organizers struggling to prove ROI; the 2026 report puts that at 40%. The practical driver of the closure is CRM integration: teams whose event platforms write into their CRM are dramatically more likely to report confident ROI numbers than teams running events as an isolated workstream.
The remaining 40% are not a lost cause. They are, largely, the programs that have yet to complete the CRM-to-event-platform integration project that the measurement-confident programs finished in 2023 and 2024.
Dynamic registration flows convert at 24.4%, more than double the 11.6% rate of static flows (Bizzabo platform benchmark)
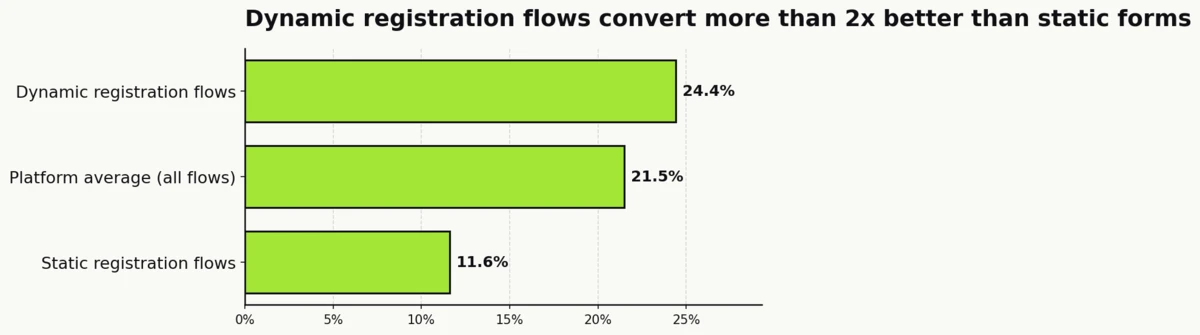
Bizzabo’s in-platform conversion benchmark puts the overall visit-to-registration rate at 21.5%. Splitting the data by registration form type, dynamic forms (which personalize based on referrer or audience segment) hit 24.4% conversion, while static forms sit at 11.6%. That is a 12.8-point gap, or roughly a 2x uplift, from a single tactical choice.
Operators treating registration as a templated afterthought are leaving a large fraction of the acquisition funnel on the table. The same platform data shows registered-to-attended conversion averages 52%, meaning a 400-registration event will typically seat around 208 attendees.
Sources: Bizzabo
In-Person, Virtual, and Hybrid Format Mix
The format debate has resolved into a durable three-way split: in-person dominates revenue and perceived value, virtual persists as an always-on top-of-funnel channel, and hybrid has retrenched into a narrow set of deliberate use cases. Format selection is now a portfolio decision driven by intent, not a single answer to the pandemic’s aftermath.
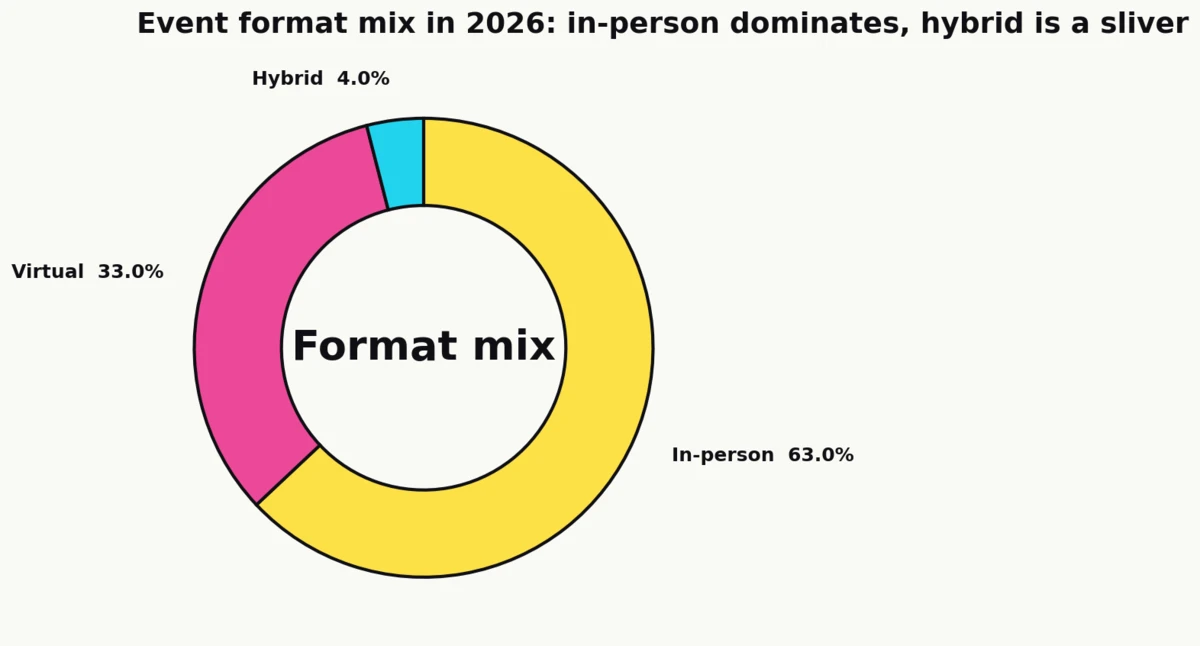
63% of events are in-person, 33% are virtual, and only 4% are hybrid (Bizzabo platform benchmark 2026)
The hybrid-is-the-future narrative dies on this chart. Across the anonymized event mix on one major platform, hybrid sits at 4% of all events, roughly one in twenty-five. In-person dominates at 63%, and virtual holds 33% on the strength of recurring webinars and regional online sessions.
| Format | Share of events (2026) |
|---|---|
| In-person | 63% |
| Virtual | 33% |
| Hybrid | 4% |
Hybrid has not disappeared because it is technically difficult; it has settled at 4% because it is expensive and rarely outperforms either pure in-person or pure virtual on a per-dollar basis. The programs still running hybrid are doing it for flagship events where a small in-person audience needs to reach a larger remote one.
54% of attendees plan to attend more in-person events in 2026 compared to last year (Bizzabo State of Events 2026)
The attendance-side momentum is on in-person. A majority of attendees (54%) explicitly say they will attend more in-person events in 2026 than in 2025, a signal that is rare to see at the full-sample level in any category.
71% of attendees believe in-person B2B conferences are the most effective way to learn about new products or services (Bizzabo State of Events 2026)
For product marketers specifically, the attendee data is even more lopsided. Seven in ten B2B attendees (71%) rank in-person conferences as the most effective discovery format, ahead of websites, demos, peer networks, or digital ads. For SaaS teams evaluating where to route their next $200,000 of discretionary marketing spend, that is the most defensible argument for an event line item.
53% of attendees plan to attend more webinars in 2026, and 61% of organizers report increased webinar attendance year over year (Bizzabo State of Events 2026)
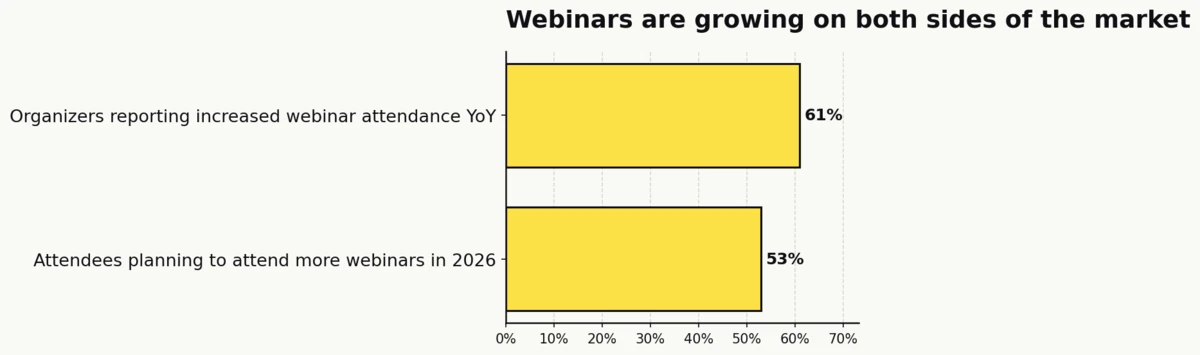
Virtual is not contracting; it is compartmentalizing. Webinars, the dominant virtual format, are growing on both sides: attendee intent (53%) and organizer-reported attendance (61%). The signal is that “virtual” in 2026 means recurring webinars, not one-off virtual conferences.
Sources: Bizzabo
Event Technology and CRM Integration
Event technology used to mean registration and check-in. In 2026 it means an integrated stack: registration, mobile app, audience engagement, on-site lead and data capture, sponsor analytics, and (increasingly) generative AI layered across the pipeline. Teams that have completed the integration project report dramatically higher ROI confidence than teams that have not.
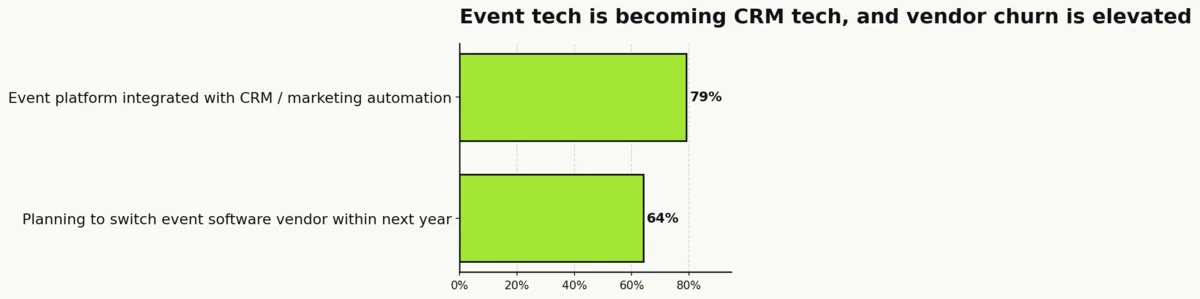
79% of organizers have their event platform integrated with CRM or marketing automation (Bizzabo State of Events 2026)
The 79% figure is the clearest single indicator that events have crossed from “isolated marketing program” to “component of the revenue operations stack.” The remaining 21% are the cohort that still struggles to report ROI, because event data does not flow into the same system of record as paid media, SDR activity, or pipeline reporting.
64% of organizers plan to change their event management software vendor within the next year (Bizzabo State of Events 2026)
Vendor consolidation pressure is high, and the churn expectation is unusually elevated for a B2B software category. Treat the 64% as directional rather than literal (Bizzabo is itself a vendor, and organizers who answered “yes” to “considering a change” do not all switch). The signal that matters is that procurement teams are shopping, which compresses pricing and accelerates feature roadmaps across the category.
73% of attendees expect in-person conferences to use modern event technology (Bizzabo State of Events 2026)
The demand side has set the table-stakes threshold at 73%. Anything less than that, and a share of attendees will read the experience as behind the times. “Modern event technology” in the survey framing means mobile apps, digital badging, personalized agendas, and on-site engagement tooling.
55% of attendees say the mobile event app can make or break their experience (Bizzabo State of Events 2026)
A majority (55%) rate the app as pivotal to their overall experience. That is a remarkable share for a piece of conference infrastructure that five years ago was optional. The “make or break” wording is the exact survey language, not an editorial paraphrase.
Sources: Bizzabo
AI in Event Marketing
Generative AI moved from curiosity to production inside event programs in the span of roughly eighteen months. The adoption signal in the 2026 data is almost unanimous, and the use cases cluster around the stages of the event lifecycle where marketing teams already spend the most discretionary time: measurement, communications, and agenda design.
95% of organizers expect their use of AI in events to increase in 2026, with 35% anticipating significant increases (Bizzabo State of Events 2026)
95% is, for a technology-adoption question, effectively unanimous. 35% expect significant increases, the most aggressive adoption-intent tier Bizzabo tracks.
Primary AI use cases cluster around analytics and measurement, event marketing and communications, and agenda and content design (Bizzabo State of Events 2026)
Bizzabo’s open-ended use-case question surfaces three dominant deployment areas: analytics and measurement (closing the ROI gap), marketing and communications (email sequences, attendee outreach, content creation), and agenda and content design (session curation, personalization, post-event content repurposing). Organizers flagged accuracy, trust, and governance as the most common concerns in the same response set.
The practical implication for event teams planning 2026 investments is that AI spend should land in those three workflows first, because that is where both the operator demand and the vendor feature development are concentrated.
Sources: Bizzabo
Attendee Engagement and Program Benchmarks
Attendee data is where the event-marketing story stops being a vendor story and becomes an audience story. Attendees treat well-designed live events as high-trust discovery channels, they engage more deeply than virtual-only programs assume, and the networking component (historically under-designed) is measurably the weakest part of the typical 2026 event experience.
95% of organizers say incorporating experiential learning into events is important (Bizzabo State of Events 2026)
The 95% figure is directionally important but a low-bar question (“is this important?” tends to score high). Read it as near-universal agreement that the bar for an event is no longer a keynote plus coffee, but structured experiential and hands-on programming.
75% of organizers rate immersive experiences that let attendees disconnect as important (Bizzabo State of Events 2026)
“Disconnect” is the survey’s exact wording. Three in four organizers (75%) now see events as, in part, a deliberate escape from the day-job distraction layer. That reframes the physical design of the event (lounges, photo moments, quiet rooms, tactile activations) from hospitality niceties into measurable engagement drivers.
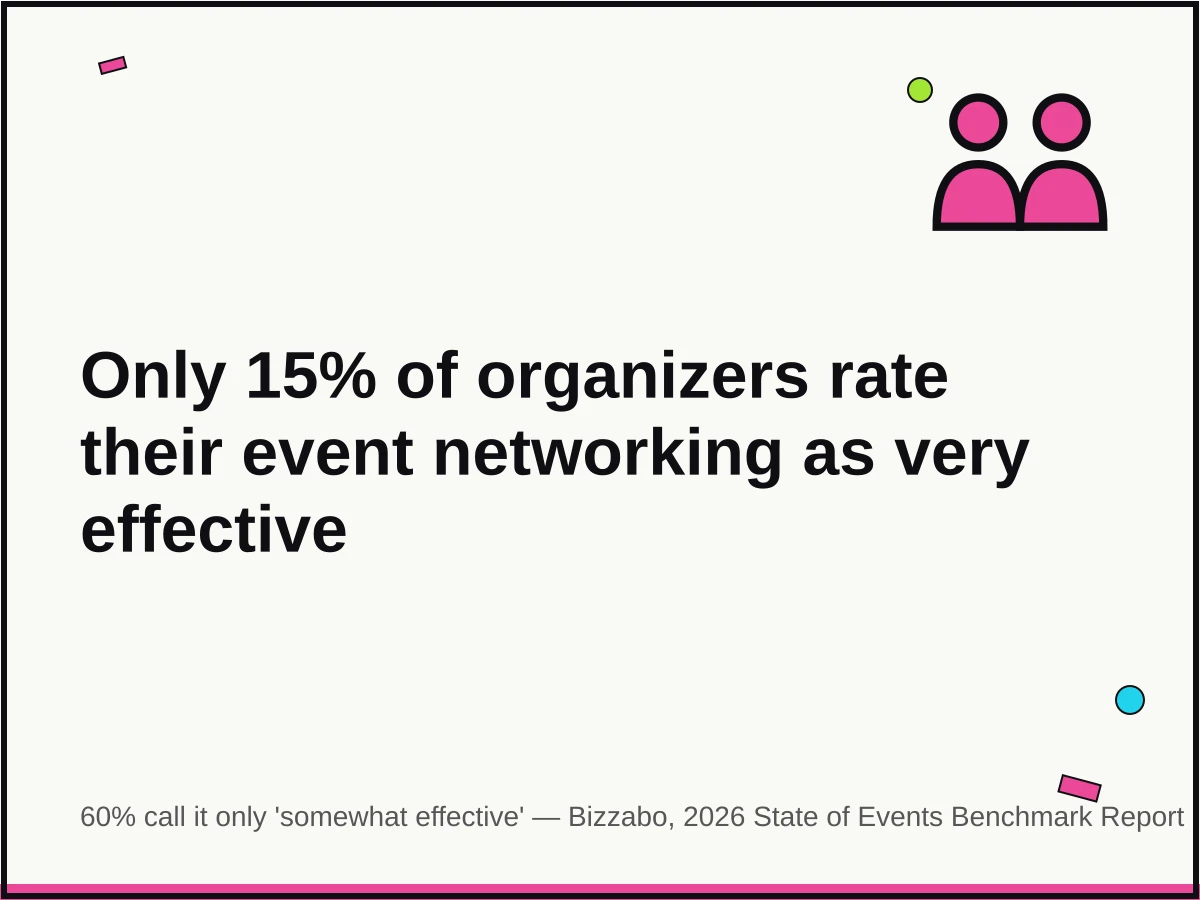
Only 15% of organizers rate their networking experiences as “very effective,” down sharply from 2025 (Bizzabo State of Events 2026)
Networking is the weakest self-reported part of the 2026 event experience. Only 15% rate it very effective, and the share has fallen since 2025. Bizzabo’s accompanying commentary is blunt: “Networking can no longer be left to chance. High-performing events are designing, facilitating, and staffing networking with the same rigor as content and sponsorship strategy.”
For operators, this is the clearest investable gap in the data. Dedicate budget to structured matchmaking, facilitated roundtables, and scheduled 1:1 slots, and the program’s perceived value jumps on a metric competitors are neglecting.
47.3% of attendees participate in community features such as chat or discussion spaces, with events generating an average of 574 messages per event (Bizzabo platform benchmark)
Nearly half of attendees engage in in-app community features. The 574-messages-per-event figure is the absolute benchmark: if an operator is running a 400-person conference and seeing 50 messages, the experience is under-engaged; 574 is the median on the Bizzabo platform.
Virtual session completion averages 71% of total session length, with an average viewing time of 46 minutes (Bizzabo platform benchmark)
Virtual attendees watch a median of 46 minutes per session and complete 71% of the session’s length. That is meaningfully higher than what standalone webinar platforms typically report, suggesting that attendees at an anchor event give the content more attention than they give an isolated webinar.
82% of organizers create video-on-demand content from events, and 53% gate at least some of it (Bizzabo State of Events 2026)
The post-event content flywheel is standard practice. More than four in five programs (82%) repurpose session video, and just over half (53%) gate at least some of that content for lead capture. The gating decision is the interesting one: teams that gate treat the event library as a pipeline asset; teams that leave it open treat it as an SEO and demand-gen asset.
The average event program runs 11.8 hours across 7.5 sessions, with a 98.5% session-completion rate for attended sessions (Bizzabo platform benchmark)
The format benchmark is roughly a day-and-a-half equivalent of programming across seven to eight sessions. The 98.5% completion rate measures only attended sessions (not registered ones), which makes sense: people who walk into a session tend to stay.
Sources: Bizzabo
Trade Shows and B2B Exhibition Recovery
Trade shows are the part of the category with the longest and best-documented data record. CEIR (the Center for Exhibition Industry Research) maintains a composite Total Index measured quarterly and analyzed by Oxford Economics, which makes the exhibition trajectory unusually reliable relative to the rest of event marketing.
US B2B exhibitions reached 91% of pre-pandemic levels in H1 2024, following 89% in full-year 2023 and 75% in 2022 (CEIR via TSNN)
The recovery arc is the cleanest single trend line in the 2026 data set. From a 75% trough in 2022, the CEIR Total Index climbed 14 points in a year, then another 2 points in the first half of 2024. Adam Sacks of Oxford Economics summarized the outlook: “Our outlook calls for continued incremental growth toward full recovery by 2026.”
Full recovery of the B2B exhibition industry is forecast by 2026 (CEIR via TSNN)
The 2026 full-recovery forecast aligns almost perfectly with the publication year of most statistics pages written this cycle. If the forecast holds, the US B2B exhibition industry will end 2026 at 100% of its pre-pandemic benchmark across all four CEIR Total Index components (attendance, net square feet, exhibitor count, revenue).
Sources: CEIR / TSNN
Key Takeaways
Event marketing in 2026 is a measured-expansion story, not a recovery story. The single most citable number is that 78% of B2B event organizers now call in-person conferences their most impactful marketing channel, with budgets growing at four in ten programs and holding flat at another four in ten. Trade show activity is within two or three points of its pre-pandemic peak. The category is compounding toward a projected $2.5 trillion by 2035.
The measurement story is the most consequential structural finding. The share of organizers who report difficulty proving event ROI dropped from 70% in 2025 to 40% in 2026, a 30-point closure in a single year. The driver is integration, not sophistication: 79% of organizers now have their event platform connected to CRM or marketing automation, and the confident-ROI segment overlaps almost entirely with the integrated-stack segment. For the 21% of teams still running events as an isolated workstream, the 2026 investment priority is clear.
The format story is settled. The three-way split on one major event platform is 63% in-person, 33% virtual, 4% hybrid, and all three shares are structurally stable. Virtual has compartmentalized into recurring webinars (53% of attendees plan to attend more, and 61% of organizers report higher attendance year over year) rather than one-off virtual conferences. Hybrid has retrenched into a narrow, expensive, flagship-event use case. Marketers should stop asking “in-person vs. virtual” and start asking “which format for which intent, measured against which pipeline outcome.”
The engagement story is where operators have the clearest investable gap. Only 15% of organizers rate their networking experiences as “very effective,” a share that has fallen since 2025, while 95% say experiential learning is important and 75% want immersive experiences that let attendees disconnect from their day jobs. That is a widening gap between design intent and execution, and the teams that close it first will pull budget away from the programs that do not.
The forward look is cautious optimism. AI adoption is near-unanimous (95% of organizers expect use to increase, 35% significantly), teams are smaller than the budgets suggest (45% operate with just one to three people). For operators, 2026 is an optimization year rather than a growth year. The durable edge comes from integrated stacks, AI-assisted personalization for the measurement and communications layers, and the boring discipline of consistent post-event attribution.
Sources
- Allied Market Research (2026). “Events Industry Market Outlook.” https://www.alliedmarketresearch.com/events-industry-market-A19588
- Bizzabo (2026). “State of Events 2026 Benchmark Report and Event Marketing Statistics.” https://blog.bizzabo.com/event-marketing-statistics
- CEIR / Oxford Economics via TSNN (2024). “CEIR Reports Business-to-Business Exhibitions Show Healthy Growth.” https://www.tsnn.com/news/ceir-reports-business-to-business-exhibitions-show-healthy-growth