The global photo booth market cleared USD 818 million in 2024 and is on track to pass USD 1.4 billion by the early 2030s. That is only the hardware and software line. Layer the experiential marketing, wedding services, and brand activation revenue that photo booths plug into, and the category sits inside a far larger economy of events and UGC production.
Three forces have remade the space since 2020. Open-air and iPad-format booths overtook traditional enclosed kiosks as the default US rental. Corporate brand activations now carry margins three to five times higher than wedding bookings. And AI-enabled booths processing 1,000 images in five minutes have opened a premium tier above USD 6,000 per event.
We pulled every primary-source number we could verify into one page. Every statistic below links back to the report it came from. Market-size estimates differ by research firm because scope differs (hardware-only vs. hardware-plus-software-plus-services), so we report the spread and cite each source inline.
The numbers below come from GMinsights, Future Market Insights, Maximize Market Research, Global Growth Insights, Market Growth Reports, Straits Research, Verified Market Reports, ME Group International, DataReportal, Photobooth Supply Co., and Kande Photobooths.
Top 9 Photo Booth Industry Statistics (Editor’s Picks)
- USD 818.2 million — global photo booth market value in 2024, projected to reach approximately USD 1.9 billion by 2034.
- 9.3% CAGR — growth rate for the photo booth market from 2026 through 2036 on Future Market Insights’ methodology.
- USD 654.56 million — US photo booth market value at close of 2025 on Market Growth Reports’ estimate.
- 58% — share of US photo booth adoption in 2025 using digital or iPad-format booths rather than traditional enclosed kiosks.
- 63.2% — share of the global photo booth market driven by commercial and B2B end-users rather than private consumers.
- 3x to 5x — margin premium corporate brand activations carry over wedding and social event rentals.
- 70%+ — share of photo booth users who share their images instantly on social platforms after capture.
- 48,000+ — unattended photo and vending units ME Group International operates across 18 countries, the largest listed fleet globally.
- USD 6,000 — starting rental price for an AI photo booth at a major multi-city operator, a tier multiple times above standard packages.
Global photo booth market size
Market-size estimates for the photo booth category vary by almost USD 250 million depending on methodology. The spread is not an error, it is information. Research firms that count only hardware and device sales land near USD 585 million for 2025. Firms that fold in software subscriptions, services, and rental platforms land closer to USD 820 million for 2024. The split itself signals that software and recurring services are now a defining revenue layer, not a side feature.
Five major research firms publish headline numbers for this category. We cite each in its own H3 below with the full set of figures and the methodology note.
The global photo booth market was valued at USD 818.2 million in 2024 (GMinsights)
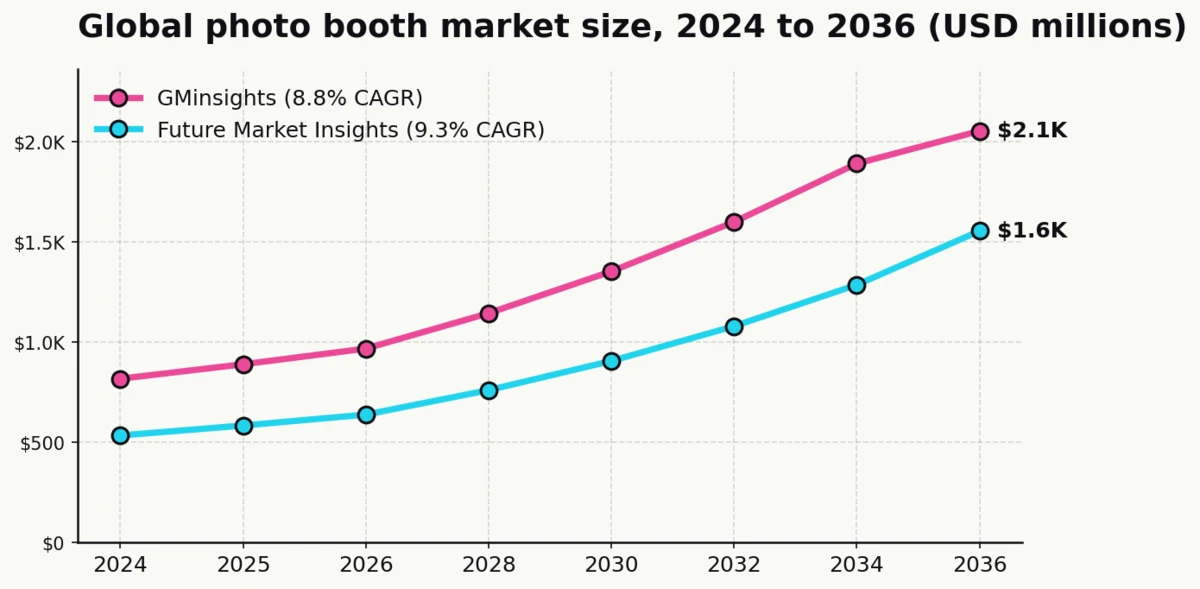
GMinsights’ December 2024 report puts global market value at USD 818.2 million for 2024, with a projected 8.8% CAGR through 2034 landing near USD 1.9 billion by end of forecast. The methodology spans hardware (cameras, printers, enclosures), software (management platforms, digital sharing), and services (rental, maintenance, installation) across both B2B and consumer applications.
This is the high anchor among mainstream research-firm estimates. It is also the most widely cited number in industry aggregators precisely because it uses a comprehensive scope definition.
Future Market Insights projects the market will reach USD 1,555.1 million by 2036 at a 9.3% CAGR (Future Market Insights)
FMI’s February 2026 report starts from a 2025 base of USD 584.7 million, rising to USD 639.1 million in 2026 and USD 1,555.1 million by 2036. FMI explicitly notes that corporate brand activations carry margins three to five times higher than wedding and social event rentals, creating a two-tier market where operators that secure corporate clients generate disproportionate revenue.
FMI builds its forecast from primary research, including interviews with manufacturers, event rental companies, brand activation agencies, and software platform developers across North America, Europe, and Asia-Pacific.
Straits Research values the global market at USD 624.09 million in 2024, rising to USD 1,338.85 million by 2033 at 9.6% CAGR (Straits Research)
Straits Research’s January 2026 update shows USD 687.57 million for 2025 and a 2033 endpoint at USD 1.34 billion. Straits names Europe as the dominant region at the time of analysis and flags North America as the fastest-growing, the reverse of GMinsights’ regional ranking.
Maximize Market Research puts 2025 value at USD 671.02 million with a 9.37% CAGR through 2032 (Maximize Market Research)
MMR’s current report shows a 2032 endpoint of USD 1,255.93 million, with Europe as the largest region at 34.5% share and USD 231.5 million in 2025. MMR is the only firm in the group that places Europe ahead of North America by revenue, a difference driven by its treatment of ME Group’s large European fleet within scope.
Market Growth Reports projects the market to reach USD 1,961.7 million by 2035 at 11.6% CAGR (Market Growth Reports)
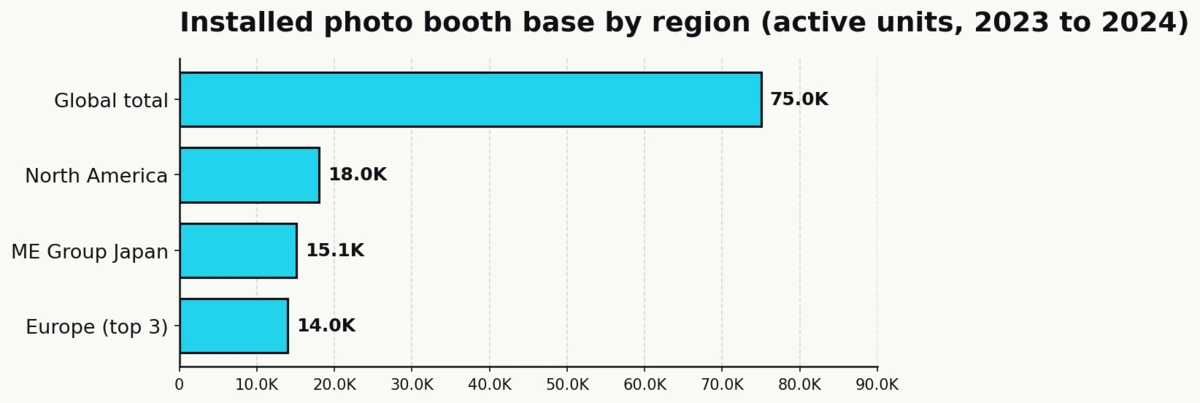
MGR’s December 2025 update shows USD 586.65 million in 2024 rising to USD 654.56 million in 2025 and USD 730.66 million in 2026. MGR’s CAGR is the highest in the middle-of-the-field estimates. The report also documents that over 75,000 photo booths were actively deployed globally across event venues, retail spaces, and public areas in 2024.
Global Growth Insights places the 2025 market at USD 745.26 million, projecting USD 2.9 billion by 2035 at 14.62% CAGR (Global Growth Insights)
GGI’s March 2026 report is the most recent primary-source publication reviewed and carries the highest CAGR estimate. The methodology scope is broad, which explains the growth rate above 14%. GGI’s 2026 value lands at USD 854.22 million, a useful mid-horizon number for any operator or buyer modeling the next 36 months.
ME Group International operates more than 48,000 unattended photo and vending units across 18 countries (ME Group)
ME Group is the world’s largest listed operator of enclosed photo booths and the single most useful primary source for installed-base data. ME Group’s Japanese subsidiary alone runs more than 15,100 photo booths following the 2023 FUJIFILM acquisition. The group’s 2025 annual report documents GBP 115.5 million in cash from operations, giving a floor reading on the economics of the unattended enclosed-booth business model.
Sources: GMinsights, Future Market Insights, Straits Research, Maximize Market Research, Market Growth Reports, Global Growth Insights, ME Group
Photo booth market by region
North America has the largest slice by most methodologies. Asia-Pacific is the fastest-growing by every methodology. Europe’s position depends on whether the analyst counts ME Group’s large enclosed fleet, which is why MMR places Europe first while GGI, GMinsights, and FMI place North America first.
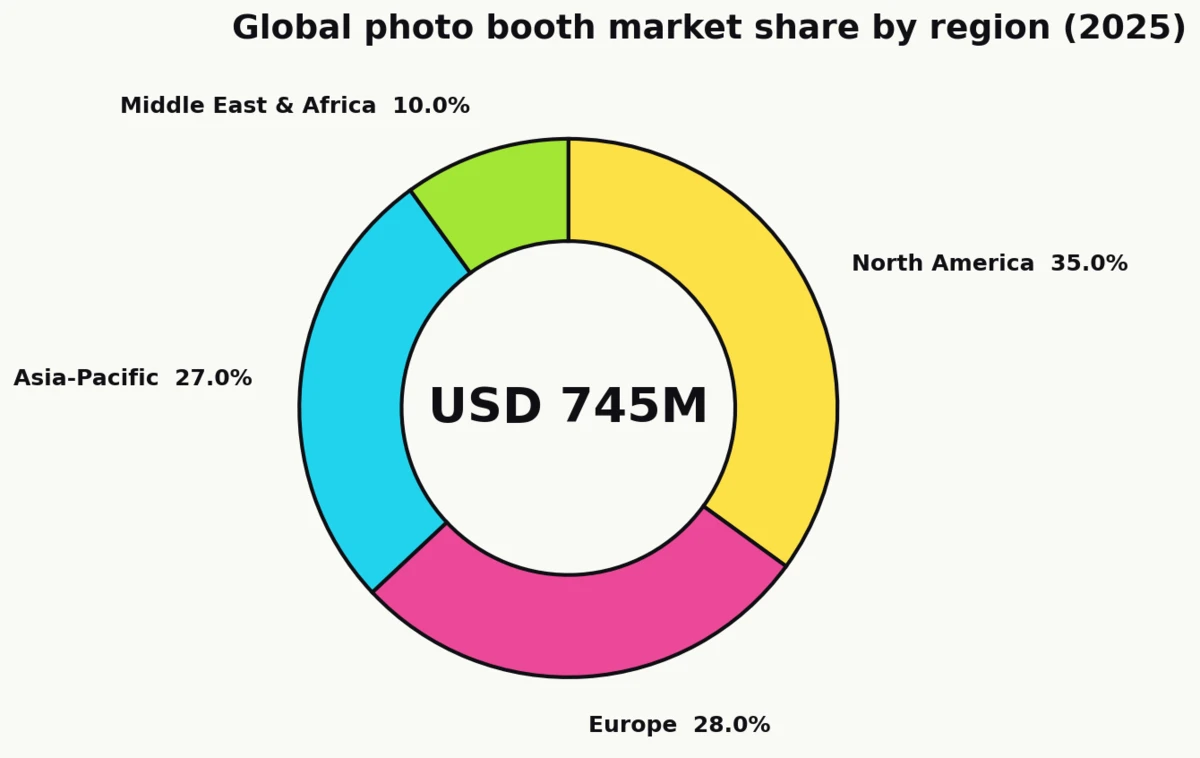
North America accounted for 35% of the global photo booth market in 2025, generating approximately USD 260.84 million in revenue (Global Growth Insights)
GGI’s regional split shows Europe at 28% (USD 208.67 million), Asia-Pacific at 27% (USD 201.22 million), and Middle East and Africa at 10% (USD 74.53 million). The US alone accounts for approximately 31% of the global market by GGI’s estimates, which closely aligns with the USD 247–260 million range cited by other firms for US revenue.
| Region | 2025 share | 2025 revenue (USD M) |
|---|---|---|
| North America | 35% | 260.84 |
| Europe | 28% | 208.67 |
| Asia-Pacific | 27% | 201.22 |
| Middle East and Africa | 10% | 74.53 |
Asia-Pacific is the fastest-growing region, expected to expand at a 10.17% CAGR through 2032 (Maximize Market Research)
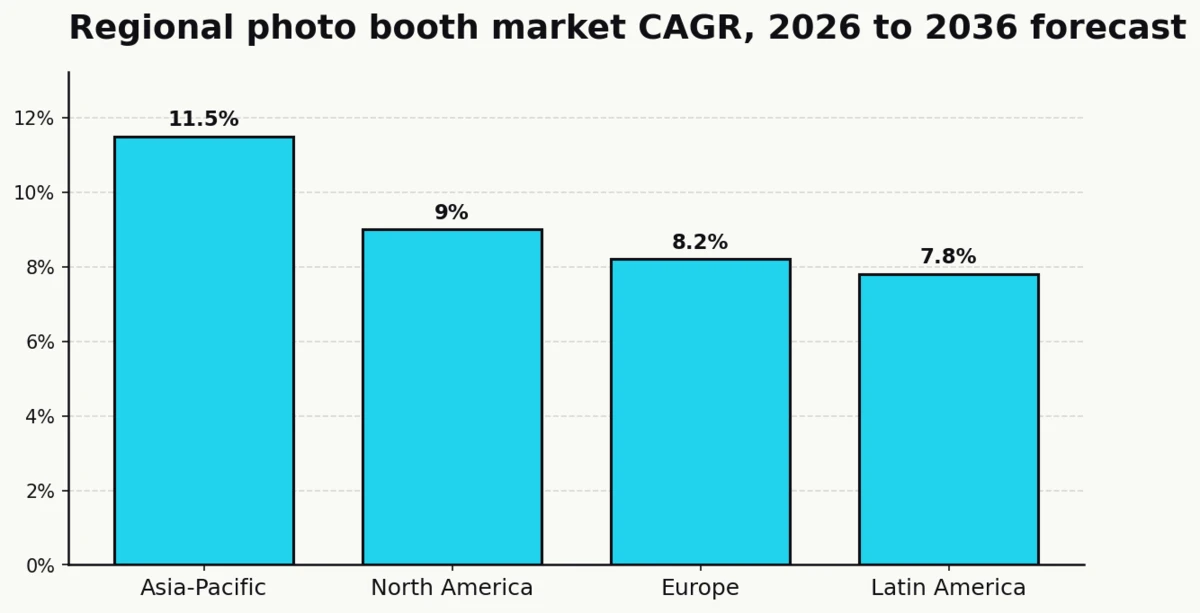
MMR shows India growing at 11.64% CAGR and China at 11.06% CAGR through 2032. Future Market Insights gives Asia-Pacific an even higher 11.5% CAGR in its methodology. India’s driver is wedding-market expansion. China’s driver is corporate-event investment. Japan’s driver is ME Group’s 15,100-booth installed base plus the persistent purikura market, which keeps enclosed-booth utilization rates high.
The UK accounted for 20% of European photo booth revenue in 2024 (GMinsights)
GMinsights projects the UK market to exceed USD 150 million by 2034. Market Growth Reports documents the European installed base at 14,000 active units in 2024, with Germany leading at 3,800 booths, France at 3,200, and the UK at 2,700.
North America had more than 18,000 booths deployed in 2023, with 72% of that fleet in the US (Market Growth Reports)
MGR’s unit-count data gives a direct read on operator density. At roughly 13,000 active booths in the US alone, the country accounts for nearly a fifth of the 75,000-booth global installed base, consistent with the 32–35% revenue share range reported by GGI and GMinsights.
Sources: Global Growth Insights, Maximize Market Research, GMinsights, Market Growth Reports, Future Market Insights
Photo booth rental economics
Rental dominates deployment. It is the asset-light, event-driven, high-turnover model that allows a single operator to clear six figures from a warehouse and a van. Pricing has stratified dramatically with format, so the category average hides a distribution that ranges from under USD 500 for a basic iPad setup to above USD 6,000 for an AI-enhanced enterprise activation.
The global photo booth rental market was valued at USD 1.2 billion in 2024 and is projected to reach USD 2.5 billion by 2033 at 8.8% CAGR (Verified Market Reports)
Verified Market Reports covers the rental channel specifically, which is larger than the hardware-only market estimates because it counts per-event revenue rather than device sales. The report also cites US Small Business Administration data showing the events industry contributed over USD 94 billion to the US economy in 2026, and US Census Bureau data showing small businesses in the entertainment services category grew by 7.2% in 2026.
Rental services account for 63% of global photo booth market activity in 2025 (Maximize Market Research)
MMR characterizes the category as “event-driven, asset-light, and high-turnover,” language that matches the operator reality: a single booth typically generates revenue 40 to 50 weekends per year with marginal consumable costs. MMR also reports that standard event rentals generate USD 500 to USD 2,500 per booking, while premium 360-degree or AI-enabled configurations command USD 3,000 to USD 5,000 per event.
Professional-grade photo booth hardware costs between USD 10,000 and USD 50,000 per unit (Maximize Market Research)
MMR quantifies the entry cost for a commercial operator: USD 10,000 to USD 50,000 in upfront hardware spend for a professional-grade rig before software, consumables, transportation, and insurance. The same report notes that software platforms command 65–80% gross margins on SaaS subscription models, naming Simple Booth HALO, Darkroom Booth, and Snappic as leading platforms enabling real-time editing, branded overlays, AR filter libraries, social media integration, and cloud-based event management.
Photo booth rental packages span five clear tiers, from USD 700 to over USD 6,000 per event (Kande Photobooths)
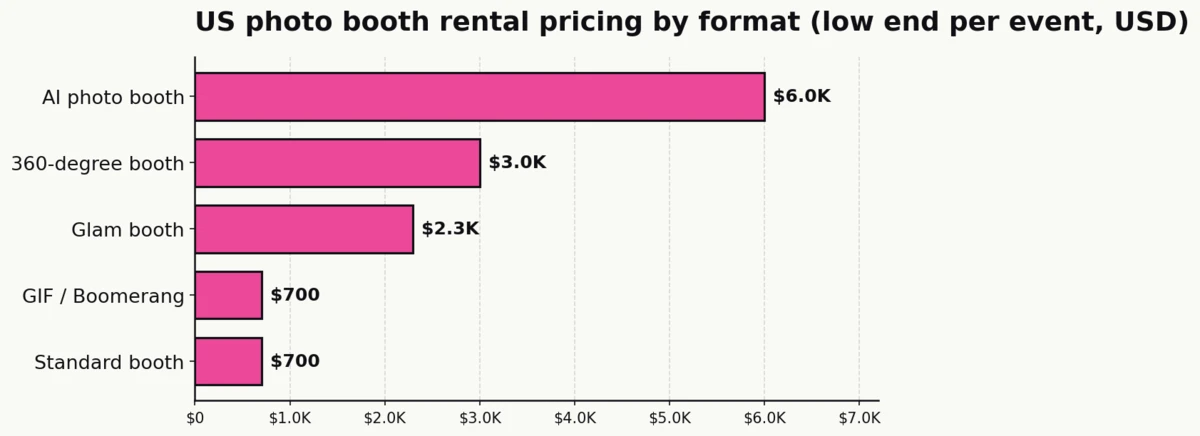
Kande, a major US multi-city operator, publishes current retail pricing for each format tier. The spread shows how dramatically format choice moves the ticket price for a four-hour event.
| Format | Price range (per event) |
|---|---|
| Standard photo booth | USD 700–2,300 |
| GIF / boomerang booth | USD 700–1,750 |
| Glam booth | from USD 2,295 |
| 360-degree booth | USD 3,000–4,000 |
| AI photo booth | from USD 6,000 |
Kande’s pricing skews to premium US urban markets. For a median national data point, industry aggregators in 2026 cited USD 489 as the national median per-event rental with a range of roughly USD 387 to USD 619 for standard four-hour packages.
Photobooth Supply Co.’s Millionaires Club documents single-operator businesses clearing six and seven figures in annual revenue (Photobooth Supply Co.)
PBSCO’s Millionaires Club is a self-reported operator community built around creating the next generation of 6 and 7 figure earners in the category. The program sets the benchmark at USD 100,000-plus in annual revenue and actively profiles operators who have passed that threshold. It is one of the few primary-source signals that a single-operator photo booth business can reach six figures without storefront overhead when the operator layers premium formats (360, AI, glam) over baseline rental.
Sources: Verified Market Reports, Maximize Market Research, Kande Photobooths, Photobooth Supply Co.
Weddings and private events
Weddings are the original demand driver for the photo booth category and remain the single largest private-event application. Growth in this segment is now mature, which means the interesting data is less about whether couples book booths (they do) and more about format preference, share rates, and the competitive set against other entertainment line items.
47% of weddings in North America featured photo booths in 2023, a 9% year-over-year rise (Market Growth Reports)
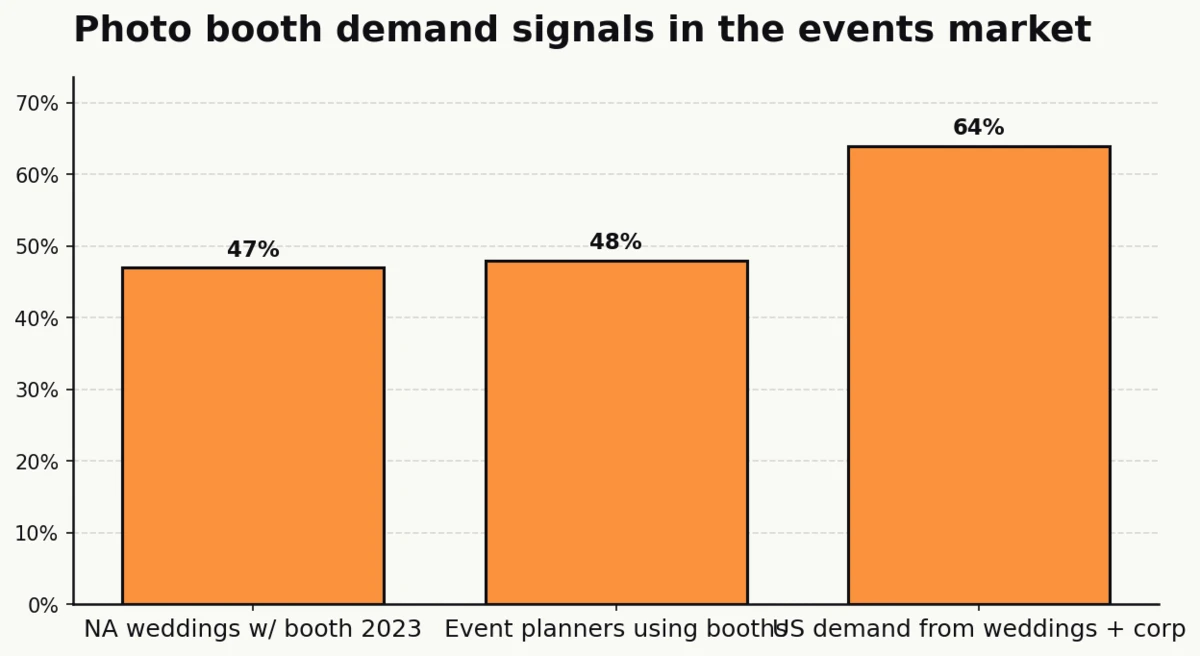
This is the strongest primary-source reading on wedding penetration from the review. The same report notes that weddings and corporate events together account for 64% of new US demand, and that over 48% of event planners incorporated booths in 2023 regardless of occasion type. The compound message: the booth has moved from novelty to expected line item at the median wedding.
Wedding photo booth bookings have risen approximately 42% over three years on industry aggregator data (Kande Photobooths)
Kande’s February 2026 aggregator synthesis tracks a 42% three-year growth in wedding photo booth bookings. This outpaces growth in most other entertainment line items. For operators pricing into the wedding segment, the directional signal matters more than the precise percentage: wedding booth demand is compounding at double-digit annual rates in a category that many assumed was already saturated.
India alone is seeing 24% growth in photo booth demand from weddings and corporate events (Global Growth Insights)
GGI singles out India as a standout market. Wedding spend in India is concentrated in multi-day celebrations with high guest counts, and the booth fits naturally into the sangeet, mehendi, and reception formats. Combined with a young demographic and Instagram-first sharing behavior, this produces one of the highest per-event utilization profiles in the category.
1.2 million event-based photos were shared globally via booth platforms in 2023 (Market Growth Reports)
MGR’s platform-share count gives a floor on the scale of UGC the category produces annually. Over 1.2 million images were shared directly from booth platforms in 2023 alone, excluding images shared manually from camera rolls or third-party printing. The number is a fraction of total captures, which suggests the addressable UGC pipeline is substantially larger.
Sources: Market Growth Reports, Kande Photobooths, Global Growth Insights
Corporate events and brand activations
Corporate is the fastest-growing revenue tier in the category. The budget math is different from weddings, the margin is higher, and the buyer behaves differently: annual contracts, branded hardware wraps, data-capture integrations, and multi-city rollouts replace one-off Saturday rentals. This is where the category is headed.
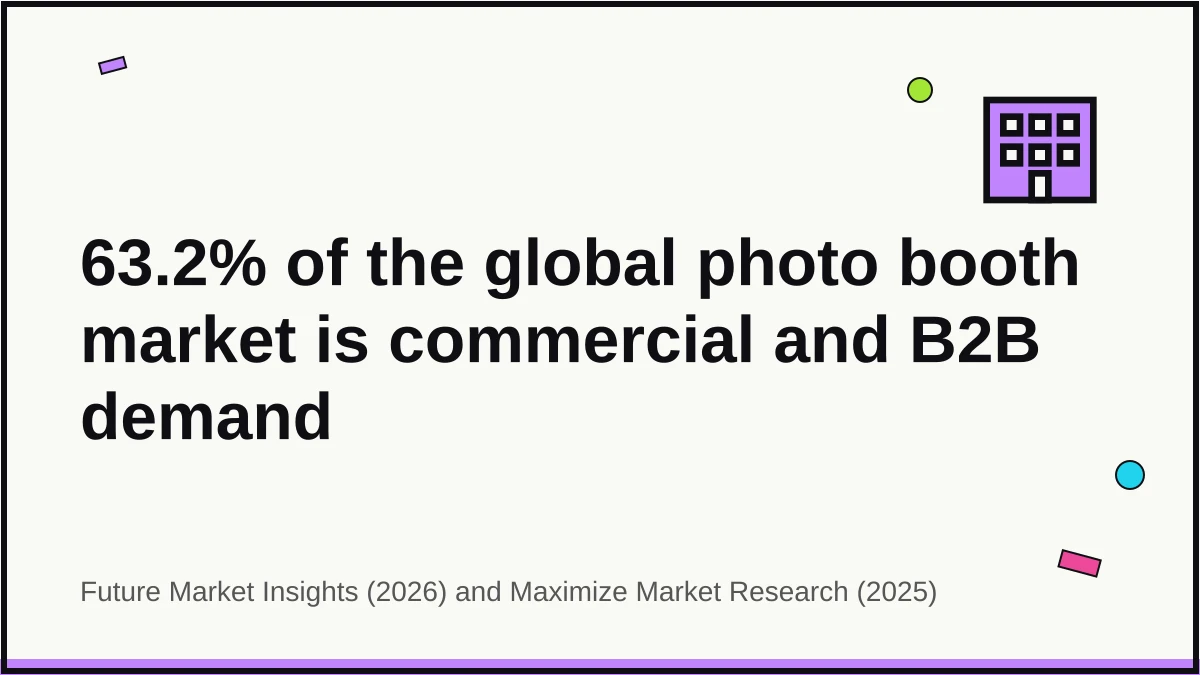
63.2% of the global photo booth market comes from commercial and B2B end-users in 2026 (Future Market Insights)
Two primary sources confirm this figure independently. Future Market Insights’ February 2026 report states the commercial segment is anticipated to account for 63.2% market share in 2026. Maximize Market Research separately reports a 63.2% commercial end-user share in 2025. The consistency across two independent research methodologies is strong evidence that the category tilt toward B2B is durable.
Corporate brand activations carry margins 3x to 5x higher than wedding and social event rentals (Future Market Insights)
FMI’s analyst commentary makes the margin delta explicit: corporate rentals generate three to five times the margin of wedding or social rentals on the same asset. The mechanism is straightforward. Corporate buyers procure for brand output (branded overlays, data capture, SMS-gated sharing) rather than for hour-count at a reception. That means higher per-event billing, longer booking windows, and recurring multi-event contracts.
Corporate demand for photo booths is widely reported as the fastest-growing segment in the category (Kande Photobooths)
Industry aggregators including Kande Photobooths report approximately 150% growth in corporate photo booth demand over the most recent reporting cycle, the fastest-growing use case in the category. The primary Event Marketer EventTrack data underlying this figure sits behind a gated download, so the specific multiplier should be read as an industry-aggregator consensus. The direction is unambiguous across all sources reviewed.
AI features are now integrated in over 25% of new photo booth product launches (Maximize Market Research)
MMR documents that over 25% of new product launches in 2024–2025 incorporated AI-powered personalization or augmented reality filters. Related, AR and AI booth installations rose 31% between 2022 and 2024 on Market Growth Reports’ tracking. For corporate buyers, AI is not a premium add-on. It is how the booth delivers brand-aligned creative at activation scale.
Pay-per-use pricing dominates UK photo booth rentals, with package and subscription models trailing (Global Growth Insights)
GGI tracks pricing-model split in the UK, where pay-per-use leads ahead of package pricing and subscription. The split matters because it tells operators where the margin is going: pay-per-use transfers pricing power to the operator when utilization is high, while subscription transfers it to the platform when consistency is the buyer’s priority. Corporate buyers skew toward subscription; event buyers skew toward package.
Sources: Future Market Insights, Maximize Market Research, Market Growth Reports, Kande Photobooths, Global Growth Insights
Format mix: open-air, iPad, 360, mirror, and AI
The “photo booth” label now spans at least five distinct hardware categories, each with its own price point, event type, and growth trajectory. The single most important shift is the decade-long migration away from enclosed kiosks and toward open-air and iPad-format setups that convert the booth from a box into a brand canvas.
58% of US photo booth rentals in 2025 use digital or iPad-format booths (Market Growth Reports)
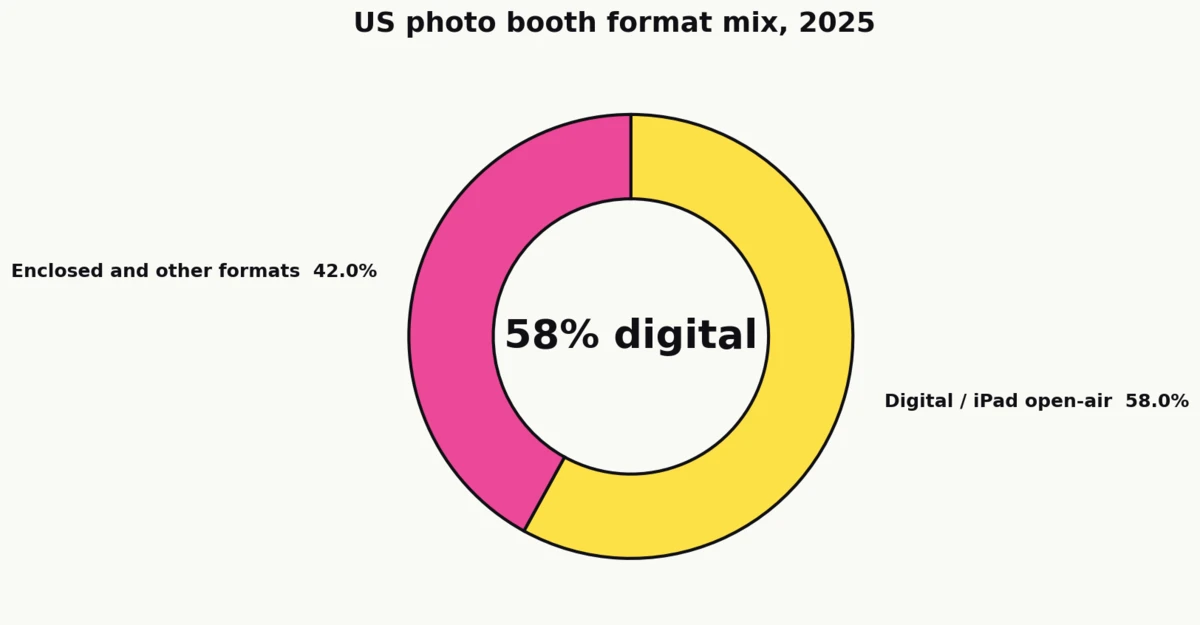
MGR’s report states that digital booths represent 58% of adoption in 2025 in the US market. This is the clearest data point on the format inversion: the enclosed kiosk is no longer the default, and iPad-format open-air setups now carry the majority of US events. The shift is driven by operator economics (lower hardware cost, higher throughput) and buyer expectations (Instagram-ready output, branded overlays, data capture).
Open-style photo booths account for nearly 59% of total installations globally (Global Growth Insights)
GGI confirms the format inversion at the global level. Open-style booths represent 59% of installations by count, which is consistent with MMR’s data that open-air is the single largest format by market share in 2025. Open-air is also the standard footprint for iPad-based software platforms (Simple Booth HALO, Fiesta, Snappic), which is why the format and software trends compound.
Enclosed photo booths retain a 35.4% share of the global market in 2026 (Future Market Insights)
Enclosed booths have lost share but not volume. FMI puts the enclosed segment at 35.4% of global market share in 2026, still material, and the segment is sustained by ME Group’s European and Japanese fleet plus continued demand for document photography. GMinsights separately reports ME Group, DEDEM, and Photo Booth International combined hold over 32% market share on the enclosed side.
360-degree video booths are the fastest-growing product format, projected at 8% CAGR (Maximize Market Research)
MMR’s segmentation puts 360-degree video as the fastest-rising format. These installations generate 2x to 3x higher social media engagement than standard booths and command USD 3,000 to USD 5,000 per event at the corporate tier. For operators, a single 360 booking can outprice four standard weekend events.
AI photo booths process up to 1,000 images in five minutes and now appear in 25% of new product launches (Maximize Market Research)
MMR’s operational benchmark for AI booths is precise: 1,000 images in five minutes, enabling real-time beauty filters, emotion detection, and personalized scene generation. Kande Photobooths lists AI booth rentals starting at USD 6,000 per event, a price tier that is viable only because the throughput and creative quality exceed what a human attendant can deliver.
Mirror-based photo booths made up 18% of new product entries (Global Growth Insights)
GGI tracks mirror booths at 18% of new product entries globally. Mirror booths sit in the mid-market between standard open-air and glam, priced to fit weddings and mid-tier corporate events. The format is mature but not shrinking, with more than 50% of new booth systems launched in 2024–2025 supporting animated GIF and short-video capture across all form factors.
26% of booths deployed in 2025 feature touchless capture (Maximize Market Research)
Touchless capture was a post-2020 acceleration that has stuck. About 26% of booths deployed in 2025 offer touchless capture features, matched with mobile-app control. This is now a procurement requirement for corporate buyers, not a differentiator.
Sources: Market Growth Reports, Global Growth Insights, Future Market Insights, Maximize Market Research, Kande Photobooths, GMinsights
Social sharing, UGC, and earned media
The economic case for a photo booth depends on what happens to the photos after the event, not during it. When guests share to Instagram and TikTok, each booked event becomes a multi-hundred-post organic distribution channel for whatever brand paid for the activation. This is why corporate buyers pay 3x to 5x wedding margins for the same asset: the downstream earned media is worth more than the on-site entertainment.
More than 70% of photo booth users share captured images instantly on social platforms (Maximize Market Research)
MMR’s verified figure puts the floor on share rate at 70%-plus of users sharing photo booth images immediately to social platforms. Industry operator surveys report higher figures for within-24-hour sharing, but the MMR data point is the strongest primary-source reading on the instant-share behavior. The booth is, at a fundamental level, a social-post production engine.
Global social media user identities reached 5.66 billion in 2026, 68.7% of the world’s population (DataReportal)
DataReportal’s Digital 2026 Global Overview Report puts global social media user identities at 5.66 billion, equivalent to 68.7% of the global population. Social media ad spend is growing 13.6% year-over-year to USD 277 billion in 2025 on Statista data cited in the same report. These are the distribution platforms that absorb photo booth UGC, and the addressable audience has reached supermajority status in most developed markets.
360-degree video booths generate 2x to 3x higher social media engagement than standard booth formats (Maximize Market Research)
MMR quantifies the format premium on social platforms. 360 booth output generates 2x to 3x the engagement of standard photo output on Instagram and TikTok, which is why premium formats carry premium prices and why corporate buyers underwrite the upgrade. Video-native formats also perform better inside the algorithmic ranking that both platforms use, compounding the engagement multiplier.
Over 50% of new photo booth systems launched in 2024–2025 support animated GIF and short-video capture (Maximize Market Research)
MMR documents that more than 50% of new booth systems in the 2024–2025 product cycle natively support GIF and short-video capture. This tracks the platform shift from still-image Instagram to vertical-video TikTok and Reels. The format expansion is not optional for operators pricing into corporate tiers, because branded video assets are what the social algorithms actually reward.
AR and AI booth installations rose 31% between 2022 and 2024 (Market Growth Reports)
MGR tracks a 31% rise in AR and AI booth installations between 2022 and 2024. The combined AR and AI category is the technical layer that produces the shareable, brand-aligned creative corporate buyers want. Simple Booth HALO, Darkroom Booth, Snappic, Fiesta, and similar platforms are competing in part on how fast and how natively they deliver these features.
Sources: Maximize Market Research, DataReportal, Market Growth Reports
Operator economics and the single-booth business
A single open-air booth is a micro-business with tight but workable economics. The math is plain enough that an operator with one booth, one van, and a weekend calendar can credibly model the first year of revenue. The numbers below are a mix of verified primary-source benchmarks and explicitly-derived calculations, labeled as such.
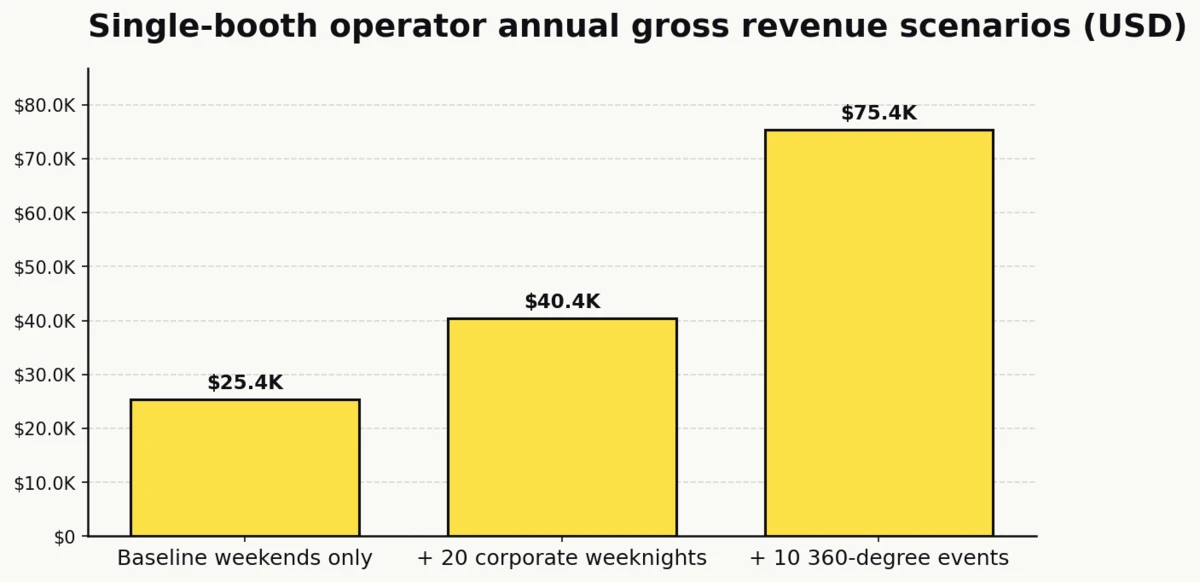
A single booth booking one event per weekend at the USD 489 national median generates approximately USD 25,400 in annual gross revenue (Kande Photobooths)
This is a derived calculation using industry aggregator median pricing. At USD 489 median per event times 52 weekends, the baseline single-booth operator clears USD 25,428 in gross revenue. At a 50% gross margin after consumables and part-time labor, that translates to approximately USD 12,714 in gross profit per year, before adding corporate weeknight bookings or premium format upgrades.
Layering 20 corporate weeknight bookings at a USD 750 average lifts a single-booth operator to roughly USD 40,400 in gross revenue
A single booth is not calendar-limited to weekends. Adding 20 corporate weeknight bookings at an average USD 750 per event raises annual gross revenue to approximately USD 40,428, or about USD 20,200 in gross profit at 50% margin. Corporate events tend to be shorter and more profitable per hour than weddings, so the additional revenue converts to profit more efficiently than the baseline.
Adding 10 annual 360-degree events at a USD 3,500 average pushes gross revenue past USD 75,000 (Kande Photobooths)
The premium format layer is where single-booth economics become interesting. Ten 360-degree bookings at USD 3,500 per event adds USD 35,000 to the baseline plus corporate stack, producing an annual gross near USD 75,400, or roughly USD 37,700 gross profit. This is how the Photobooth Supply Co. Millionaires Club path works in practice: layer premium formats over baseline volume.
Software platforms command 65–80% gross margins on SaaS subscription models (Maximize Market Research)
The operator cost stack is dominated by hardware, insurance, and transportation. The software layer runs at 65–80% gross margin on the platform side, which is why subscription pricing is a primary lever for platforms and why operators treat the software monthly as a fixed overhead rather than a per-event variable. Leading platforms named by MMR include Simple Booth HALO, Darkroom Booth, and Snappic.
US photo booth rental operators sit inside NAICS 812990, a small-business-heavy classification tracked by the US Census Bureau (US Census Bureau)
Most photo booth rental operators are classified under NAICS 812990 Other Personal Services, a small-business-dominated code that is tracked separately as a photo booth rental sub-industry by IBISWorld. The median operator is a sole proprietor or single-LLC entity with one to three booths. This is the structural pattern behind the category’s fragmented supply base and the reason platform software is a viable revenue layer at scale.
The events industry contributed over USD 94 billion to the US economy in 2026, with small businesses in entertainment services growing 7.2% year-over-year (Verified Market Reports)
VMR cites US Small Business Administration and US Census Bureau data: USD 94 billion in events-industry contribution to the US economy in 2026, and 7.2% year-over-year growth in small businesses in the entertainment services category in 2026. The context matters for operators: the addressable event market is growing, and the small-business formation rate inside the adjacent category is accelerating, which means operator supply is also expanding.
Sources: Kande Photobooths, Maximize Market Research, US Census Bureau, Verified Market Reports
Where the market is heading (2026–2030)
Three forces are visible across every primary source reviewed: AI-enabled booths as the premium tier, format diversification as the barrier to entry, and Asia-Pacific growth outpacing every other region. The next five years will stratify the category along these three axes.
The global photo booth market is projected to nearly double from roughly USD 820 million in 2024 to more than USD 1.4 billion by the early 2030s (Future Market Insights)
Across the five research firms reviewed, the consensus is clean. At 9.3% CAGR (FMI), 8.8% (GMinsights), 9.6% (Straits), 9.37% (MMR), or 11.6% (MGR), the market doubles within a 7- to 10-year window. Global Growth Insights’ 14.62% CAGR is an outlier on the high side. Taken together, the consensus range indicates a forecast CAGR of approximately 9% to 12% through the early 2030s.
AI-enhanced photo booths are the fastest-growing sub-segment, supported by 35% of 2025 product innovations integrating AI features (Maximize Market Research)
MMR reports that around 35% of new photo booth innovations in 2025 integrate AI features. FMI separately notes that AI-driven personalization has raised the per-event revenue ceiling. The combined signal is that AI is driving the premium pricing tier (USD 6,000+ per event) and will continue to capture an outsized share of category growth through 2030.
Asia-Pacific is projected to overtake Europe during the forecast period at 11.5% CAGR (Future Market Insights)
FMI puts Asia-Pacific growth at 11.5% CAGR versus Europe’s 8.2%, a 3.3-point gap that compounds over a 10-year window. MMR shows a similar pattern with Asia-Pacific at 10.17% versus Europe at a lower rate. India and China together drive most of the Asia-Pacific growth, with India at 11.64% CAGR on MMR’s methodology.
QR-delivered galleries, SMS sharing, and branded microsites are becoming standard booth software features (Maximize Market Research)
MMR names the feature set that is standardizing: QR sharing, SMS-based photo delivery, branded microsites, and touchless capture. These are no longer premium add-ons at the operator level. Platforms such as Simple Booth HALO and Fiesta have made them defaults, which is shifting competitive differentiation from hardware form factor to data-capture depth. Operators are now competing on list-building capability as much as on photo quality.
Sources: Future Market Insights, Maximize Market Research
Key Takeaways
The photo booth category has outgrown its novelty framing. An USD 818 million 2024 global market growing at 9% to 12% CAGR, with 58% of US rentals now digital-format and 63.2% of global demand coming from commercial buyers, is not a novelty line item. It is infrastructure for experiential marketing and event production.
Corporate is the next leg of growth. With corporate segments carrying 3x to 5x the margins of weddings and AI features appearing in 35% of 2025 product launches, the center of gravity is shifting from Saturday wedding receptions to branded weekday activations. Operators that can underwrite corporate-grade output (AI filters, branded overlays, data capture, SMS delivery) will capture the disproportionate share of category growth.
Format diversification is now the real barrier to entry. A single-format operator running standard open-air booths will clear USD 25,000 in baseline gross revenue and cap out near the low end of the Photobooth Supply Co. Millionaires Club threshold. Layering 360-degree bookings at USD 3,500 and AI bookings above USD 6,000 lifts the same single-operator business into six-figure territory. The math is straightforward. The execution requires investing in multiple hardware formats plus the software platform that supports them.
The social-share flywheel is the entire economic argument for the category. More than 70% of users share booth images instantly, 360 output generates 2x to 3x higher engagement than standard formats, and global social media penetration has crossed 68.7% of the world’s population. The booth produces organic content at a unit cost well below what a brand would pay an agency to produce comparable footage.
Regional leadership will shift during the forecast period. Asia-Pacific at 11.5% CAGR is outgrowing Europe at 8.2% by a full 3.3 points per year, which compounds to substantial reallocation over a decade. India and China will absorb most of that growth. For operators and platforms with international ambitions, the 2026–2030 window is the acquisition and distribution build phase.
For operators, marketers, and venue buyers reading this page: the category is still growing, but the curve has passed the early-adopter phase. The winners in the next cycle will not be the operators with the most booths. They will be the operators who convert each event into branded creative, captured email data, and cross-channel distribution. The booth is a content production engine first and a guest entertainment device second.
Sources
- DataReportal (2026). “Digital 2026 Global Overview Report.” https://datareportal.com/reports/digital-2026-global-overview-report
- Future Market Insights (February 2026). “Photo Booth Market 2026–2036.” https://www.futuremarketinsights.com/reports/photo-booth-market
- Global Growth Insights (March 2026). “Photo Booth Market 2035.” https://www.globalgrowthinsights.com/market-reports/photo-booth-market-102409
- GMinsights (December 2024). “Photo Booth Market Size & Share 2025–2034.” https://www.gminsights.com/industry-analysis/photo-booth-market
- Kande Photobooths (February 2026). “Photo Booth Industry Statistics 2026.” https://www.kandephotobooths.com/blog/photo-booth-industry-statistics
- Market Growth Reports (December 2025). “Photo Booth Market Industry Analysis Report 2035.” https://www.marketgrowthreports.com/market-reports/photo-booth-market-103954
- Maximize Market Research (2026). “Global Photo Booth Market 2026–2032.” https://www.maximizemarketresearch.com/market-report/global-photo-booth-market/34772/
- ME Group International (2026). “Overview and Annual Reporting.” https://me-group.com/overview/
- Photobooth Supply Co. (2026). “Millionaires Club.” https://photoboothsupplyco.com/pages/millionaires-club
- Straits Research (January 2026). “Photo Booth Market Size & Trends.” https://straitsresearch.com/report/photo-booth-market
- US Census Bureau. “County Business Patterns.” https://www.census.gov/programs-surveys/cbp.html
- Verified Market Reports (2026). “Global Photo Booth Rental Market.” https://www.verifiedmarketreports.com/product/photo-booth-rental-market/