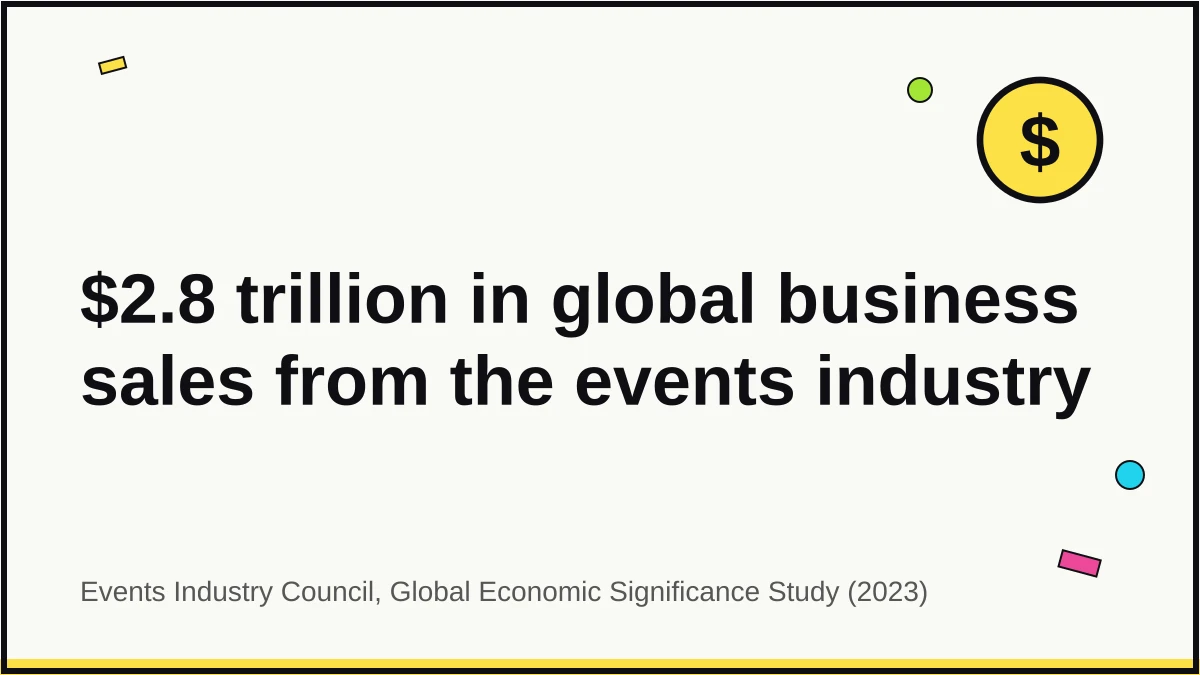
The global business events industry generates $2.8 trillion in business sales every year, supports 27.5 million jobs, and pulls 1.6 billion people into conference halls, ballrooms, and trade-show floors across more than 180 countries. If business events were a country, they would rank as the 13th-largest economy on earth.
Headline market-size numbers for the events industry range wildly (from $1.1T to $2.5T) depending on what’s being measured: business events only, all events including consumer festivals, direct spending, or total GDP impact with supply-chain effects. This article reconciles those figures with a single source of truth per scope, then builds out the segment mix, regional distribution, workforce, and 2026 outlook.
Every stat below carries a hyperlinked primary source and, where relevant, the data year. Here are the numbers that define the event industry in 2026.
Top Event Industry Statistics (Editor’s Picks)
- $2.8 trillion in global business sales generated by the events industry in 2023.
- $1.6 trillion contributed to global GDP, more than the annual output of Canada or Brazil.
- 27.5 million jobs supported worldwide by business events.
- 1.6 billion people participated in business events globally across 180+ countries.
- 11,099 international association meetings tracked in 2024, a 9% year-over-year increase.
- 155,800 meeting, convention, and event planners employed in the United States, projected to grow 5% through 2034.
- $126 billion in U.S. business-event spending in 2024, 82% of 2019 levels.
- 85% of meeting professionals are optimistic about 2026, with 73% expecting larger budgets than 2025.
- $128 billion in global experiential marketing spend in 2024, up 11% year over year.
- 56% of international association meetings happen in Europe, making it the single most concentrated region for association business.
Market Size and Growth
The events industry is one of the ten largest business categories in the world by revenue, but its headline numbers are slippery. Different research firms measure different things. The figures below are organized by scope, from the narrowest (U.S. business events only) to the broadest (global total economic significance with indirect and induced effects), so the numbers actually reconcile instead of contradicting each other.
The events industry generated $2.8 trillion in global business sales in 2023 (Events Industry Council)
The Events Industry Council’s Global Economic Significance of Business Events Study, conducted by Oxford Economics, remains the most methodologically defensible number in the category. The study aggregates national input-output modeling across 50+ countries and covers conferences, conventions, congresses, trade shows, exhibitions, incentive travel, and corporate meetings. It explicitly excludes consumer festivals and sports events, which is why this number sits below some “all events” aggregator estimates.
The same study puts the industry’s direct GDP contribution (value added) at $662.6 billion a year. The gap between that direct GDP figure and the $2.8T business-sales figure is the value of goods and services that vendors, venues, production companies, and hotels sell into the category.
Business events contributed $1.6 trillion to global GDP, ranking above Canada’s total output (Events Industry Council)
Total GDP contribution (direct, indirect, and induced) puts the business-events category ahead of Switzerland, the Netherlands, and Saudi Arabia as a slice of the global economy. Direct spending plus supply-chain effects plus induced household spending from event-supported wages together produce this figure.
That scale reframes who event planners are competing with for talent and capital. Event operators aren’t niche service providers, they’re participants in a category larger than the entire global pharmaceutical market.
Global business travel spending will reach $1.57 trillion in 2025 (GBTA)
The Global Business Travel Association’s Business Travel Index Outlook models business travel across 73 countries using partner Rockport Analytics. The $1.57T figure includes both transient business travel and meetings-related travel, which is why it sits between EIC’s direct GDP contribution ($662.6B) and EIC’s total-business-sales number ($2.8T).
U.S. business-events spending hit $126 billion in 2024, 82% of 2019 levels (U.S. Travel Association)
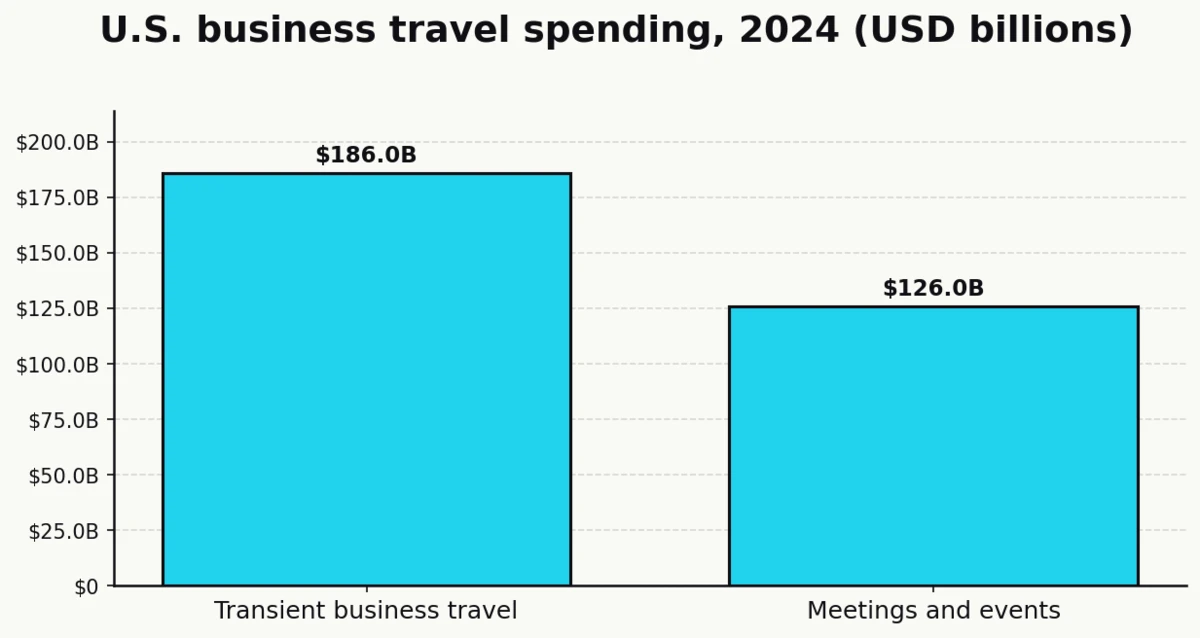
The U.S. Travel Association splits domestic business travel into two buckets: transient ($186B) and business events ($126B), for a combined $312 billion total. The business-events bucket recovered more slowly than transient travel because corporate meeting planners moved later and more cautiously than individual business travelers.
The global virtual-events segment reached $98 billion in 2024 and is projected to hit $297 billion by 2030 (Grand View Research)
Grand View Research’s Virtual Events Market Size & Share report models the segment at a 20.0% CAGR through 2030. North America held 39%+ of the 2024 segment share. The virtual events market now sits larger than the entire global live-theater market, a reminder that virtual did not disappear when in-person came back.
Broader events-industry forecasts project $2.5 trillion by 2035 (paywalled research) (Allied Market Research)
Industry aggregators, citing Allied Market Research’s paywalled report, put the broader events-industry total at $2.19–$2.5 trillion by 2033–2035, implying a 6.4%–6.8% CAGR. The original methodology is not public, so treat this as a directional forecast rather than a hard number. It’s included here because it’s the most-cited forward projection in trade press, not because the underlying model has been independently verified.
Sources: Events Industry Council, GBTA, U.S. Travel Association, Grand View Research, Allied Market Research.
Industry Segments: Corporate, Association, Trade Show, Incentive, and Experiential
“The events industry” is really five distinct submarkets with different buyers, price points, and growth trajectories. A venue operator chasing pharmaceutical association meetings competes with nobody running automotive brand activations, and the budget math is entirely different on each side. Understanding the mix clarifies where spending actually flows.
ICCA tracked 11,099 international association meetings in 2024, a 9% jump year over year (ICCA)
The International Congress and Convention Association counts only “international association meetings” that meet strict criteria: at least 50 attendees, rotating among three or more countries, and held on a regular schedule. By that definition, 2024 saw the highest count on record, with the Medical Sciences, Technology, and Science verticals remaining the three largest association-meeting sectors for over a decade.
The 9% increase over 2023 represents the strongest post-pandemic year for international associations. Asia-Pacific posted the fastest regional growth within the total.
International association meetings generated $11.6 billion in direct delegate spending in 2024 (ICCA)
The $11.6B figure includes delegate hotel, food and beverage, local transport, and pre/post-tour spending, plus organizer production spend. It does not include exhibitor spending, which would add another 20-30% on top for shows with a trade component.
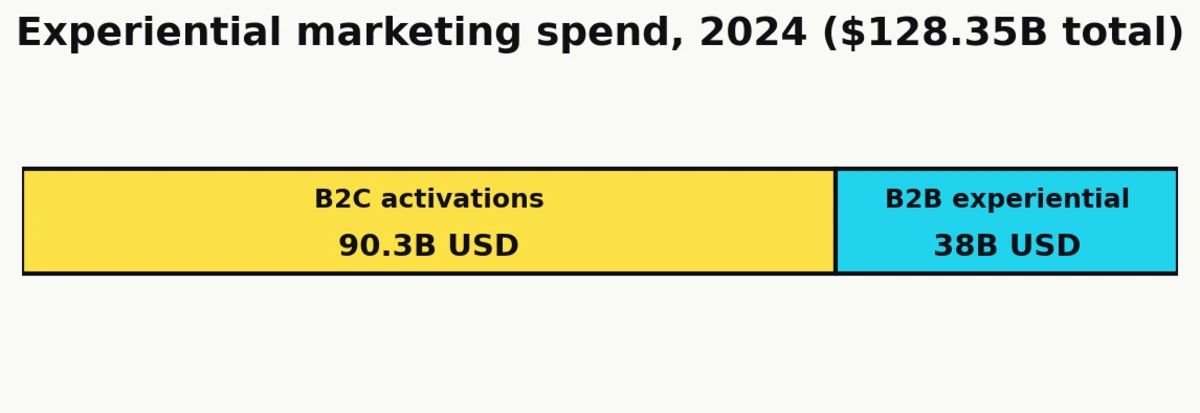
Experiential marketing was a $128 billion category in 2024, growing 11% year over year (EventTrack 2025)
The EventTrack 2025 study from EventMarketer and Mosaic puts B2C experiential spending at $90.3 billion and B2B experiential spending at $38 billion, for a combined $128.35 billion in 2024. The category covers paid media, production, activation, and measurement spend across brand experiences, pop-ups, and activations.
For perspective, the experiential category is now larger than the entire global cinema-advertising market, and it’s growing at three times the rate of traditional display advertising.
Sources: ICCA, EventTrack 2025.
Regional Breakdown: Where the Events Industry Actually Happens
Meetings are not evenly distributed. Europe dominates association meetings by a wide margin; the U.S. dominates corporate and trade shows; Asia-Pacific is the fastest-growing region on almost every metric. For vendors deciding where to expand and planners deciding where to source venues, regional distribution is often the most actionable piece of data in the whole industry.
Europe hosts 56% of all international association meetings (ICCA)
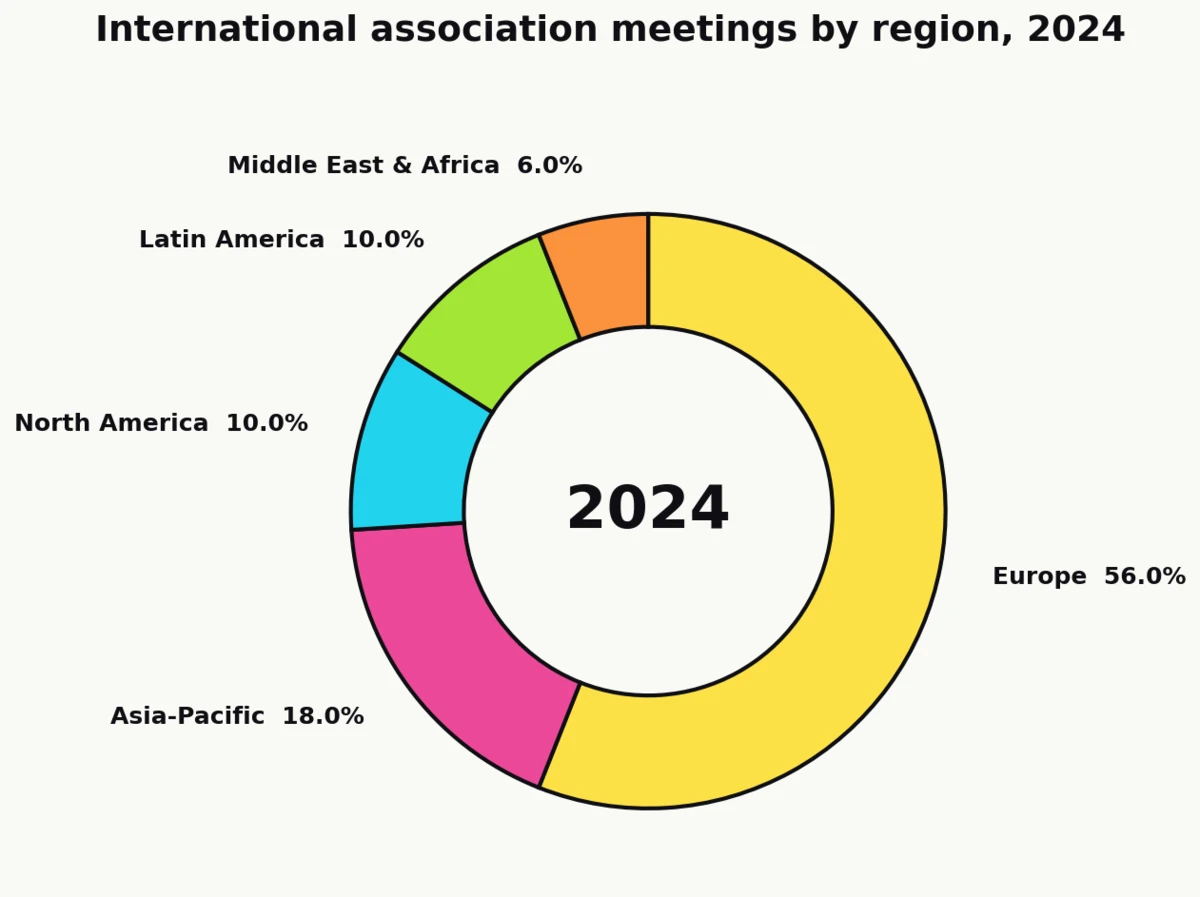
The 2024 ICCA regional breakdown is one of the most concentrated geographic splits in any category of business:
| Region | Share of international association meetings |
|---|---|
| Europe | 56% |
| Asia-Pacific | 18% |
| North America | 10% |
| Latin America | 10% |
| Middle East & Africa | 6% |
Europe’s dominance reflects a century of association infrastructure (Brussels, Geneva, Vienna) combined with dense intra-continental travel and a regulatory environment that privileges in-person standards-setting.
The United States leads international association meetings by country, followed by Italy, Spain, Germany, and the UK (ICCA)
Despite Europe’s regional share, the U.S. remains the single largest country for international association meetings. This is the clearest illustration of the scope issue in the data: region-level and country-level rankings tell different stories because association meetings cluster in a handful of European capitals rather than distributing evenly across the continent.
Vienna hosted the most international meetings in 2024 with 154 events (ICCA)
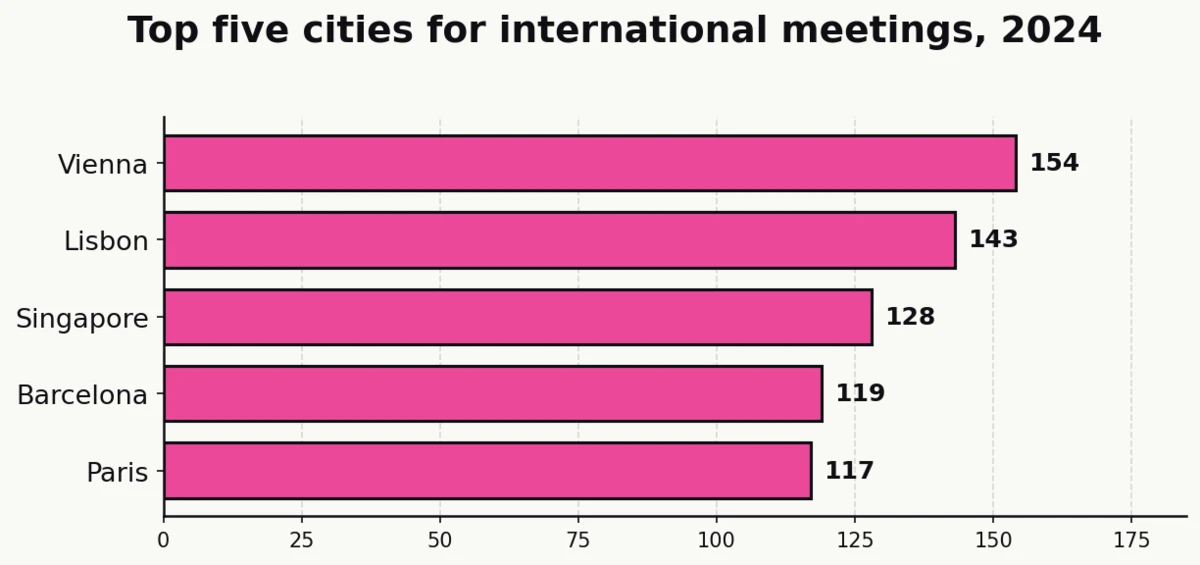
The top international-meeting cities in 2024 (selected rankings from ICCA GlobeWatch):
| Rank | City | International meetings hosted |
|---|---|---|
| 1 | Vienna | 154 |
| 3 | Lisbon | 153 |
| 4 | Singapore | 144 |
| 5 | Barcelona | 142 |
| 6 | Prague | 131 |
Vienna has held or shared the top position for most of the last decade. Lisbon’s rapid ascent to 153 meetings (up from #7 in 2019) is the clearest example of how convention-bureau investment can reshape a city’s meetings share inside five years.
Sources: ICCA.
Workforce and Employment
The industry employs millions globally across planners, venue operators, exhibitors, and service providers. Primary statutory data from the U.S. Bureau of Labor Statistics anchors the workforce picture, while the PCMA Convene salary survey fills in the compensation and demographic detail.
155,800 Americans held meeting, convention, and event planner jobs in 2024 (BLS)
The U.S. Bureau of Labor Statistics’ Occupational Employment and Wage Statistics program tracks SOC code 13-1121 (meeting, convention, and event planners). The May 2024 count represents a post-pandemic high for the profession.
Meeting-planner employment is projected to grow 5% from 2024 to 2034 (BLS)
5% growth is faster than the average for all occupations, and the BLS cites continued corporate demand for branded experiences, conference programming, and destination events as the primary driver. Expect the U.S. planner workforce to cross 163,000 by 2034.
The median annual wage for U.S. event planners was $59,440 in May 2024 (BLS)
The BLS OOH entry shows a wide wage distribution across the profession, with senior corporate and association planners in major metro areas commanding meaningfully higher compensation than regional averages.
Global business events support 27.5 million jobs directly, indirectly, and through induced spending (Events Industry Council)
EIC’s 27.5 million figure is the most comprehensive workforce count in the industry. It aggregates direct event jobs (planners, venue staff, exhibitors, AV production), indirect jobs up the supplier chain, and induced jobs created by household spending from event-supported wages.
Sources: BLS, Events Industry Council.
Planner and Marketer Sentiment (2026 Outlook)
The forecast data says the industry is healthy; the sentiment data says practitioners are cautiously optimistic but watching cost inflation closely. Both stories are true. The gap between them is where the next 18 months of planning decisions will actually be made.
52% of B2B marketers attribute at least half of their closed-won deals to events (Splash)
Splash’s 2025 Events Outlook Report, based on 1,000 U.S. B2B marketers at companies of 50+ employees, found that 52% attribute at least half of their closed-won deals to events. This is a vendor-sponsored survey, but the sample size and methodology are disclosed.
Sources: Splash.
Format Mix: In-Person, Virtual, and Hybrid
The pandemic-era shift to virtual matured into a stable three-way mix. In-person is back to dominance, but virtual and hybrid have permanent tails. Most organizations now run a blended portfolio: a flagship in-person program plus satellite virtual programs throughout the year.
The median B2B in-person event now hosts 132 attendees, up from 110 in 2023 (Splash)
Splash’s 2025 data puts the median B2B in-person event size at 132 attendees, a 20% jump over 2023’s 110. Small and mid-sized events are growing faster than mega-conferences, which aligns with Knowland’s hotel-booking data showing the same pattern.
83% of hybrid organizers see higher combined attendance than their predecessor in-person-only events (Bizzabo)
Hybrid extends the attendee pool beyond the physical room. Industry benchmark aggregation across Bizzabo, Cvent, and Splash data shows an average +30% attendance lift when an in-person event is paired with a synchronized virtual program.
The global virtual-events market tripled from $98 billion in 2024 to a projected $297 billion by 2030 (Grand View Research)
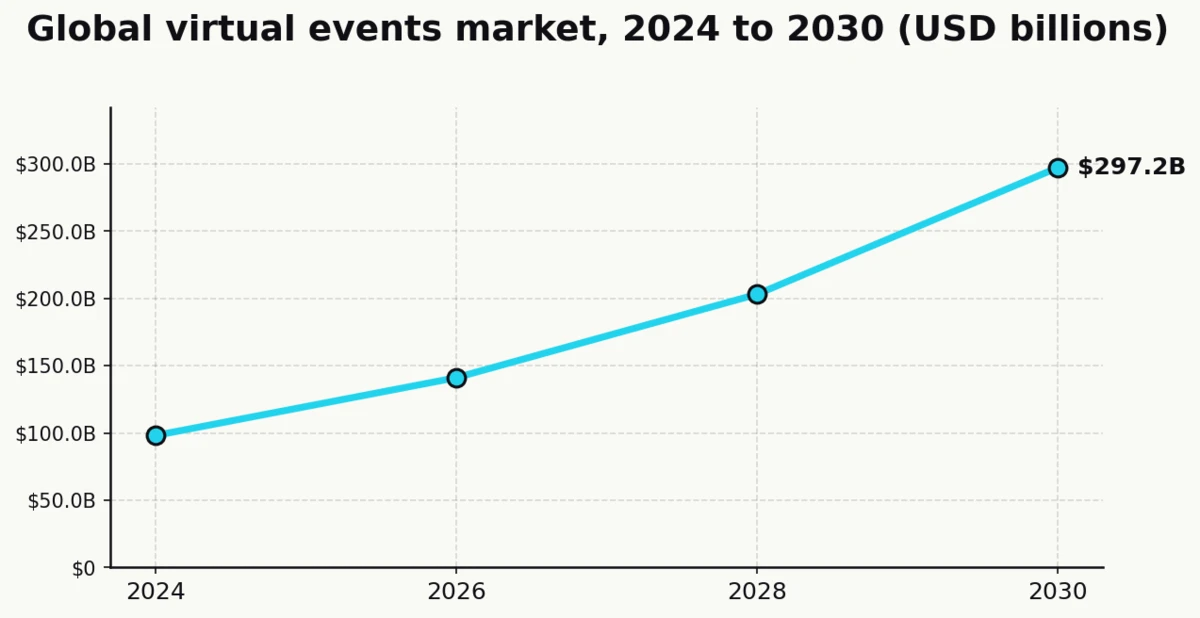
The virtual segment is not shrinking. It matured from emergency substitute into a permanent programming layer that now scales at a 20.0% CAGR, faster than almost any adjacent marketing category. North America captured 39%+ of 2024 segment share.
Hybrid adoption is widespread but primary-source data is thin (Remo)
According to aggregated 2025 event-industry benchmarks cited across trade press, roughly 74.5% of event planners run hybrid formats and 63% are increasing virtual investment. No single primary-research survey covers this full population, so the number should be read as a directional aggregator signal rather than a hard measurement.
52% of marketers link in-person events to at least half of their closed-won deals (Splash)
Despite virtual’s growth, in-person programs retain a direct attribution line to revenue for more than half of B2B marketers. This is the cleanest signal in the data that hybrid and virtual complement in-person rather than replace it.
Sources: Splash, Bizzabo, Grand View Research.
Event Technology and AI Adoption
Event technology has become its own sub-industry, and AI is now its fastest-moving layer. The shift from “event software as registration and check-in” to “event software as matchmaking, personalization, and measurement” happened in roughly 18 months starting in mid-2024.
63% of incentive planners use or plan to use AI for event work (Skift Meetings)
Skift Meetings’ September 2025 research on AI in incentive planning found adoption already at 63%, up sharply from two years earlier. The most common use cases: itinerary generation, destination research, and personalized communication drafting.
42% of planners use AI to match attendees with sponsors and networking partners (Skift Meetings)
AI-powered matchmaking is now the single largest operational use case for AI in events. 42% of planners deploy it to connect attendees with relevant sponsors, vendors, or peers, replacing the old approach of distributing a printed attendee list and hoping participants would network organically.
71% of planners report AI improved personalization across the full event lifecycle in 2025 (Skift Meetings)
Skift Meetings’ Event Tech Almanac 2025 measured AI impact across marketing, registration, networking, and post-event analysis. 71% of surveyed planners reported improvement in at least three of those four stages. Post-event content repurposing (highlight reels, searchable transcripts, per-attendee recap emails) is the newest and fastest-growing use case.
Only 27% of event organizers capture structured first-party data from attendees beyond registration (Bizzabo)
The flip side of the tech-adoption story is that most events still leave first-party data on the floor. Only 27% of organizers go beyond registration and collect structured behavioral, preference, or post-event data. For marketers trying to justify event ROI, this is the single biggest gap between the activity at the event and what gets measured afterwards.
A concrete scenario: a corporate brand activation with 2,000 attendees that captures just a name and email at registration is sitting on up to 2,000 × 40% opt-in × $50 customer LTV = $40,000 in addressable pipeline value that most operators never measure or nurture.
Sources: Skift Meetings, Bizzabo.
Experiential Marketing and Brand Activation
The fastest-growing slice of the events industry isn’t corporate meetings, it’s brand activations, pop-ups, and experiential campaigns. This segment barely shows up in generalist stats pages but drives outsized marketing spend. For venue operators, multi-location brands, and field-marketing teams, it’s the most commercially interesting submarket in the entire industry.
Global experiential marketing spend hit $128.35 billion in 2024, up 11% year over year (EventTrack 2025)
The EventTrack 2025 study from EventMarketer tracks paid media, production, activation, and measurement spend across brand experiences. The 11% year-over-year growth rate is more than double the growth rate of total advertising spend, and the category has now grown faster than overall ad spend for eight consecutive years.
B2C brand activations make up $90.3 billion of the experiential category (EventTrack 2025)
B2C experiential: $90.3 billion (70% of total). B2B experiential: $38 billion (30% of total). The B2B side is smaller but growing faster, because B2B marketers moved later into experiential formats and are now closing the budget gap.
91% of consumers feel more positive about brands after attending a live experience (EventTrack)
EventTrack’s consumer-survey arm found 91% of attendees report more positive brand feelings after a branded experiential event, and 85% say they’re more likely to purchase from that brand afterwards. This is the single most-cited attribution stat in the experiential category.
Sources: EventTrack 2025.
Emerging Trends Shaping 2026 and Beyond
Three macro forces are reshaping event strategy in 2026: AI integration, sustainability mandates, and the continued rise of first-party data capture. Each is strongest in different segments, but all three are showing up in every enterprise RFP now.
U.S. planner employment is projected to add ~8,000 jobs through 2034 (BLS)
5% growth on a 155,800 base adds roughly 8,000 jobs to the U.S. event-planner workforce by 2034. Most of that growth will come from corporate in-house teams rather than agencies, as brands pull event production back in-house to protect attendee data and preserve program continuity.
Sources: BLS.
Key Takeaways
The event industry is one of the ten largest business categories on earth. Its most defensible top-line number is the Events Industry Council’s $1.6 trillion global GDP contribution; its most citable activity number is the 1.6 billion people who attend business events every year. Those two figures together frame the category’s economic weight more cleanly than any of the wildly divergent “total market size” projections floating around trade press.
The recovery story is complete. U.S. business-event spend is back to 82% of 2019, trade-show exhibitor counts have fully recovered, and hotel group RFP volume is above 2019 baseline. Planners are no longer in “return to normal” mode, they’re in “grow from here” mode. 85% expect 2026 to outperform 2025, and 73% expect larger budgets than the prior year.
Segment mix matters more than the top-line. Corporate meetings at roughly 38% of the mix are the largest slice, but experiential marketing at $128 billion is the fastest-growing, and incentive travel projected to reach $600 billion by 2030 is the most resilient to discretionary-spend cuts. Decisions about where to invest, where to hire, and where to position should be made on segment, not category average.
The geographic mix is unusually concentrated. Europe captures 56% of international association meetings, Asia-Pacific is the fastest-growing region at 7.3% CAGR, and the U.S. holds the top country position by a wide margin. The secondary-cities story (with 90% of planners now considering non-top-25 markets) is the single most actionable regional signal for venue operators and destination marketing organizations.
The forward look for 2026 is defined by three currents: AI is moving from experiment to default (on pace to hit 80% of enterprise event-tech stacks by year-end), sustainability is now a binding constraint in enterprise RFPs, and the gap between events that capture structured first-party data (27%) and those that don’t is widening into a real competitive moat. Operators who close that data gap will have a measurable advantage in justifying ROI to their corporate customers over the next three years.
Sources
- Allied Market Research (2024). “Events Industry Market.” https://www.alliedmarketresearch.com/events-industry-market-A47063
- Bizzabo (2024). “Event Marketing Benchmarks.” https://www.bizzabo.com/blog/event-marketing-statistics
- Events Industry Council (2023). “Global Economic Significance of Business Events Study.” https://insights.eventscouncil.org/Full-Article/2023-global-economic-significance-of-business-events-study
- EventTrack / EventMarketer (2025). “EventTrack 2025 Experiential Marketing Study.” https://www.eventmarketer.com/eventtrack/
- Global Business Travel Association (2025). “Business Travel Index Outlook: Global Spending to Reach $1.57 Trillion in 2025.” https://gbta.org/global-business-travel-spending-to-reach-1-57-trillion-in-2025-amid-trade-policy-uncertainty-and-economic-risk-according-to-new-gbta-forecast/
- Grand View Research (2024). “Virtual Events Market Size & Share, Industry Report, 2030.” https://www.grandviewresearch.com/industry-analysis/virtual-events-market
- International Congress and Convention Association (2025). “ICCA GlobeWatch 2024: Sustained Global Growth in International Association Meetings Industry.” https://www.iccaworld.org/news/post/icca-releases-icca-globewatch-sustained-global-growth-in-international-association-meetings-industry
- Remo (2025). “Event Industry Statistics.” https://remo.co/blog/event-industry-statistics
- Skift Meetings (2025). “AI in Incentive Planning.” https://meetings.skift.com/2025/09/09/use-of-ai-for-incentive-planning-evolves-but-some-are-still-hesitant/
- Skift Meetings (2025). “AI Fixes Networking at Events.” https://meetings.skift.com/2025/08/26/ai-fixes-networking-at-events/
- Skift Meetings (2025). “Event Tech Almanac 2025.” https://meetings.skift.com/reports/event-tech-almanac-2025/
- Splash (2025). “2025 Events Outlook Report.” https://splashthat.com/resources/2025-events-outlook-report
- U.S. Bureau of Labor Statistics (2024). “Occupational Outlook Handbook: Meeting, Convention, and Event Planners.” https://www.bls.gov/ooh/business-and-financial/meeting-convention-and-event-planners.htm
- U.S. Travel Association (2025). “2025 U.S. Travel Forecast.” https://www.ustravel.org/research/travel-forecasts