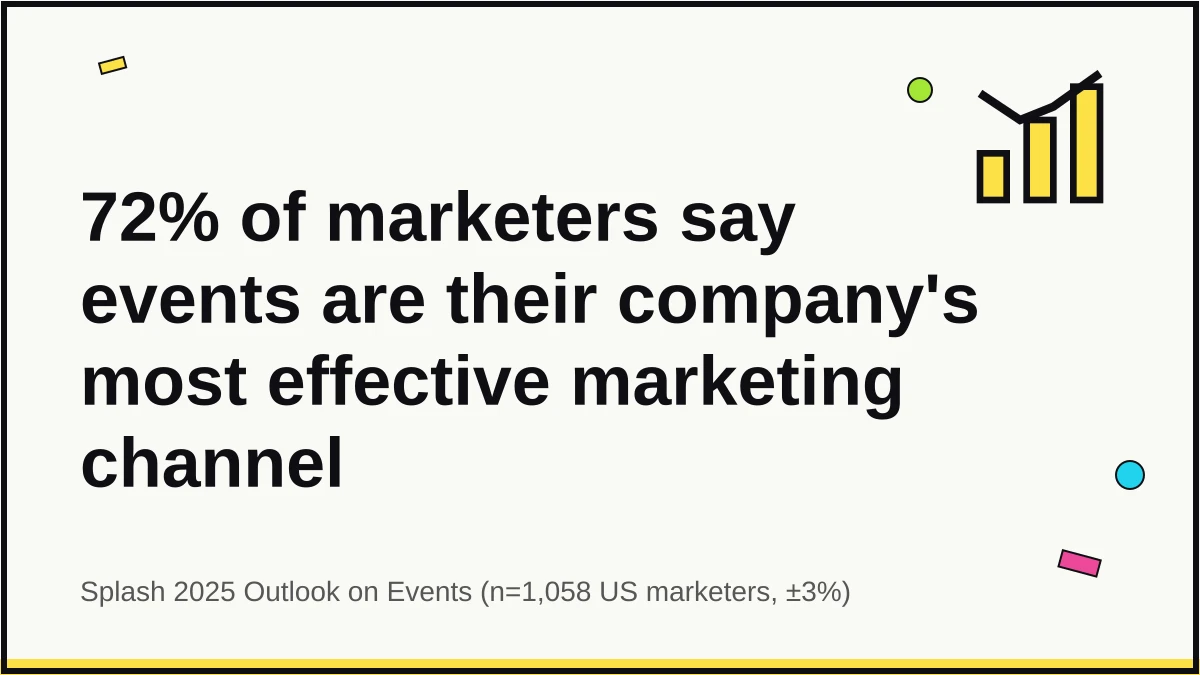
Experiential marketing is the line item most B2B CMOs expected to cut first when budgets tightened in 2024. The data says otherwise. Nearly three in four marketers now rank events as their company’s single most effective marketing channel, ahead of paid digital, email, and content.
More than half of them credit at least 50% of last year’s closed-won revenue to those same events. When the channel with the hardest-to-measure reputation starts claiming the biggest share of attribution, something has shifted in how operators, vendors, and attendees behave.
The numbers below come from primary surveys run by Splash (Cvent), Bizzabo, Forrester, AnyRoad, Kadence, and Gradient Experiential (reported by Marketing Dive). Every stat carries its publisher and year; where a figure is behind a paywall or inferred from secondary reporting, we say so.
Top 10 Experiential Marketing Statistics (Editor’s Picks)
- 72% of marketers rank events as their company’s most effective marketing channel, ahead of every digital channel.
- 90% of marketers say events help their company stand out from the competition.
- 52% of marketers attribute at least half of their 2024 closed-won deals to events.
- 66% of multi-format marketers report that in-person events generated the most revenue in 2024, a 12-point jump from 2023.
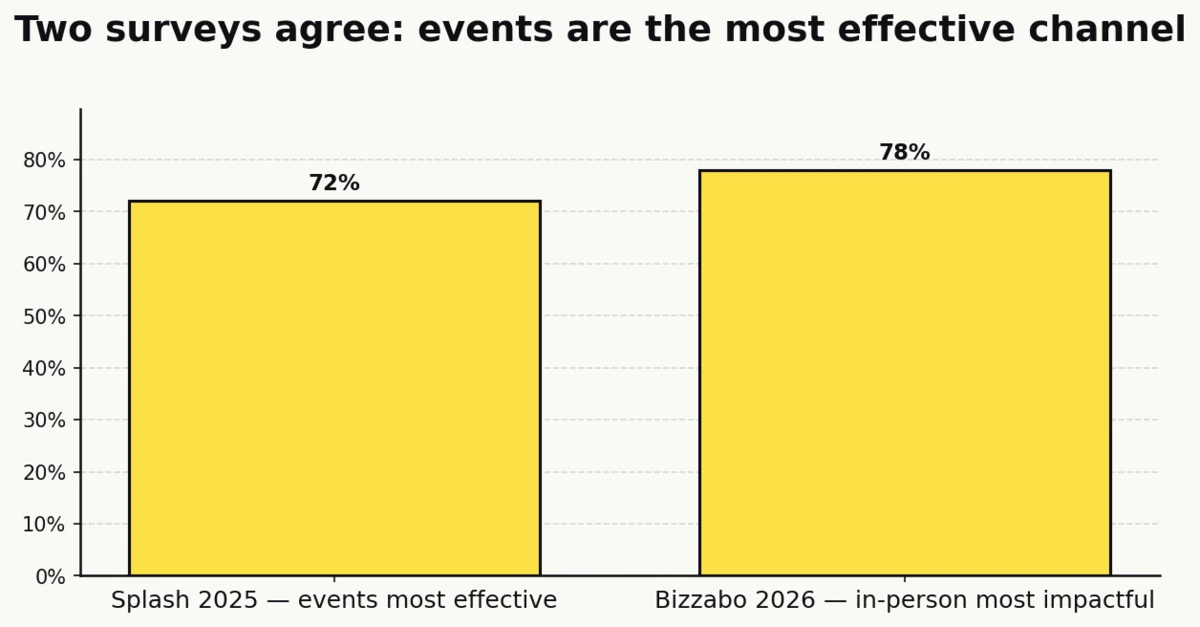
- 78% of event organizers call in-person conferences, summits, and conventions their organization’s most impactful marketing channel.
- 71% of attendees believe in-person B2B conferences are the most effective way to learn about new products or services.
- 95% of event organizers expect their organization’s use of AI in events to increase.
- 40% of organizers say proving event ROI is difficult in 2026, down sharply from 70% in 2025.
- 76% of marketers hit their revenue goals every quarter in 2024.
- 24.4% visit-to-registration conversion on dynamic registration flows versus 11.6% on static ones.
How big experiential has become
The experiential category is harder to size than display or search because the total-addressable-market reports most often cited in 2024 now sit behind dead or redirected URLs. Rather than quote phantom numbers, we anchor the scale of the category in the disclosed-methodology surveys still standing, and in the platform-level benchmarks publishers like Bizzabo draw from live customer data.
Splash’s 2025 Outlook surveyed 1,058 US marketers with a ±3% margin of error at 95% confidence (Splash)
This is the largest disclosed-methodology primary dataset on US marketer event behavior in the public domain. The sample skews enterprise and technology but spans multiple industries. Throughout this article, any Splash figure traces back to this instrument.
High-performing organizations run an average of 25 events per year, with 412 registrations and 269 attendees per event (Bizzabo)
Average attendance rate is 52% across events with recorded attendance. The benchmark draws from anonymized in-platform data rather than a survey, which gives it a different kind of weight: it captures what mature event programs actually do, not what marketers say they do.
45% of event teams operate with just 1 to 3 people (Bizzabo)
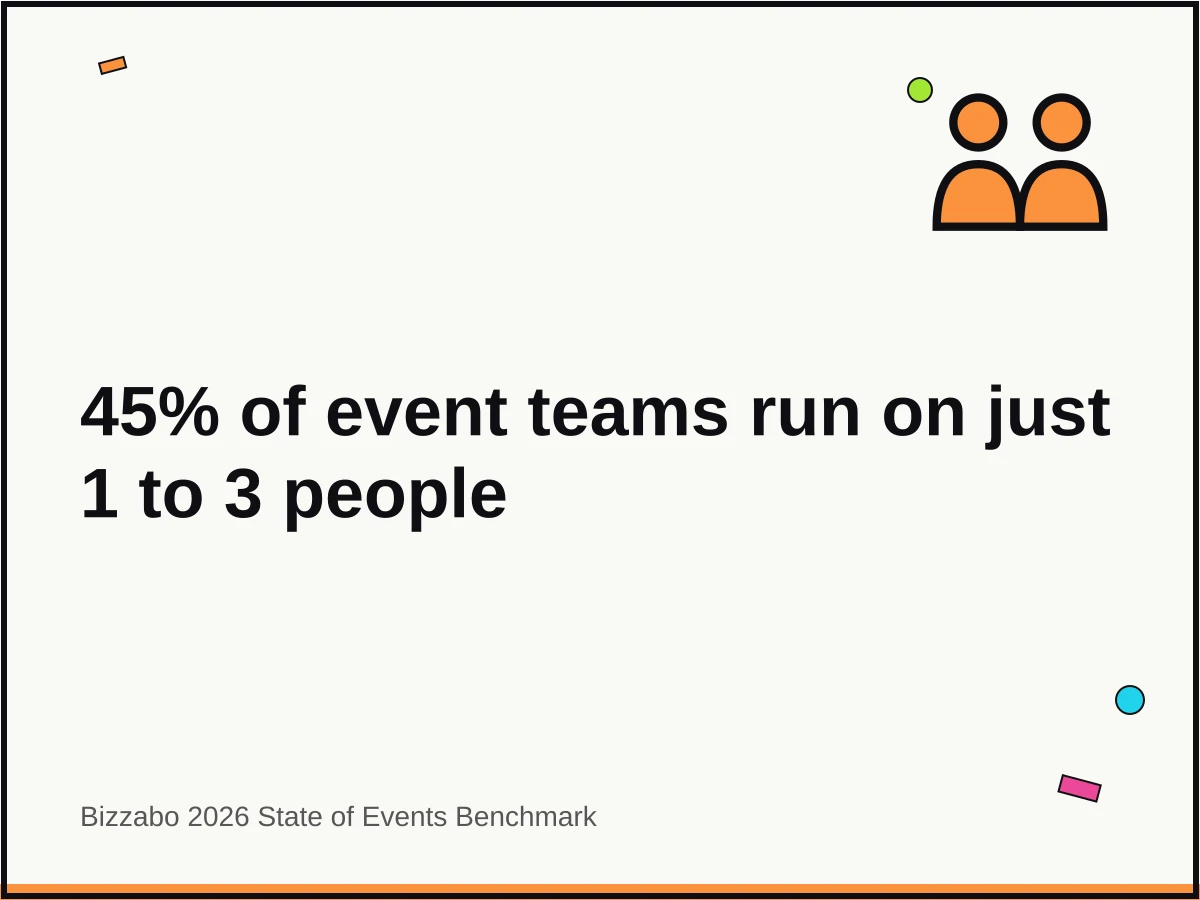
This sits uncomfortably with the 25-events-per-year benchmark above. Almost half of event programs are being run by a team smaller than a single pod of software engineers. Scalable systems, templated activation stacks, and automation tooling move from “nice to have” to “only way to ship” under this staffing reality.
Average event duration is 11.8 hours across 7.5 sessions per event (Bizzabo)
Average session completion rate sits at an unusually high 98.5%, suggesting that once an attendee lands in a session they tend to stay.
Effectiveness and ROI versus other channels
Experiential earns its budget line because it attributes. The Splash 2025 Outlook is blunt about the ranking: marketers rate events above every digital comparator when asked which channel drives the most revenue.
72% of marketers list events as their company’s most effective marketing channel (Splash)
In the same survey, 89% say events are critical for business growth and 88% say events helped their team generate a steady flow of revenue. The three numbers read together tell a coherent story: events aren’t a branding indulgence any more, they’re a revenue channel with a revenue mandate.
90% of marketers say events help their company stand out from the competition (Splash)
Differentiation is harder to fake in a live environment than in a display ad. The physicality of an event, the choreography of a booth, the specific people in the room, are all unreplicable by algorithm.
52% of marketers attribute at least half of their 2024 closed-won deals to events (Splash)
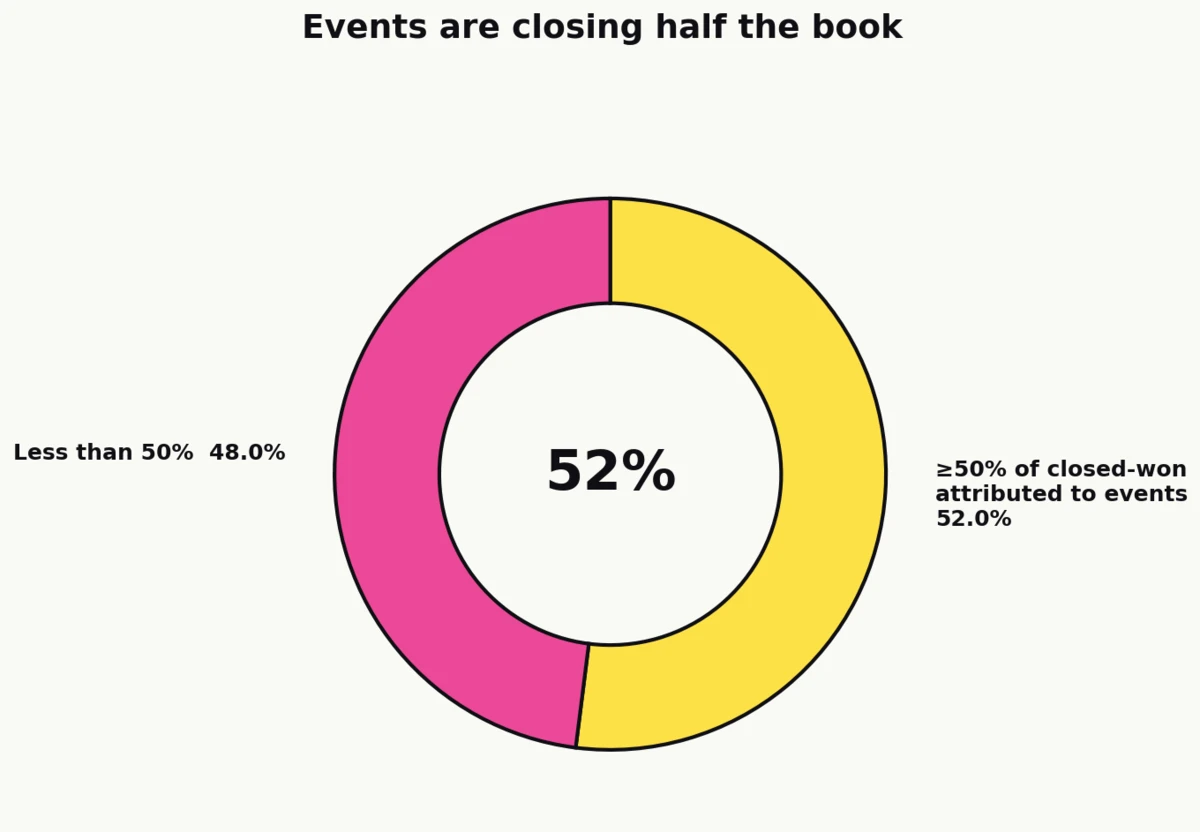
The “half of closed-won” framing is the single most citable ROI stat in the 2025 Splash data. It reframes events from “top-of-funnel awareness” to “majority of pipeline” for more than half of respondents.
72% of marketers say that when prospects attend their events, deals close faster; 31% report a 20-to-30-day decrease in sales cycle (Splash)
Sales cycle compression is the underrated piece of event ROI math. A $50,000 deal closing 25 days earlier doesn’t change topline revenue, but it moves cash forward, which is the math CFOs actually care about.
76% of marketers hit their revenue goals every single quarter in 2024 (Splash)
This is among event-led marketing teams specifically. The same survey found that marketers who adopted event-led growth were 140% more likely than non-adopters to report company growth above 50%. Splash has obvious commercial interest in the framing, so take the “140%” as directional rather than causal, but the rank-order signal is consistent.
Gradient Experiential’s 2024 survey found 80% of companies increased their experiential marketing budgets (Marketing Dive)
Attribute this one carefully: the primary report sits with Gradient Experiential (the agency, not Gradient Works, which is a B2B sales territory product). Marketing Dive’s press coverage is the most accessible citation; the underlying agency survey does not disclose sample size in the secondary reporting.
Forrester’s 2024 B2B Event Trends Survey draws on 200+ B2B marketers (Forrester)
Forrester is an analyst, not a vendor, which gives its event data independence the vendor-published reports can’t match. The 2024 Planning Survey drove blog posts on budget allocation, format preference, and measurement practices across that 200+ sample.
Sources: Splash, Marketing Dive, Forrester
Budgets, resourcing, and the time cost of events
Budget sentiment is a better leading indicator than spend totals, because it tells you where the line is moving. The 2025 and 2026 reports show a channel still gaining share of wallet, with a minority of teams reporting genuine mismatch.
69% of marketers say their company plans to increase its total marketing budget over the next 12 months (Splash)
The event line item is a direct beneficiary: more than half of respondents said at least 20% of that total budget goes toward events (excluding overhead).
55% of marketers allocate at least 20% of their marketing budget to events (Splash)
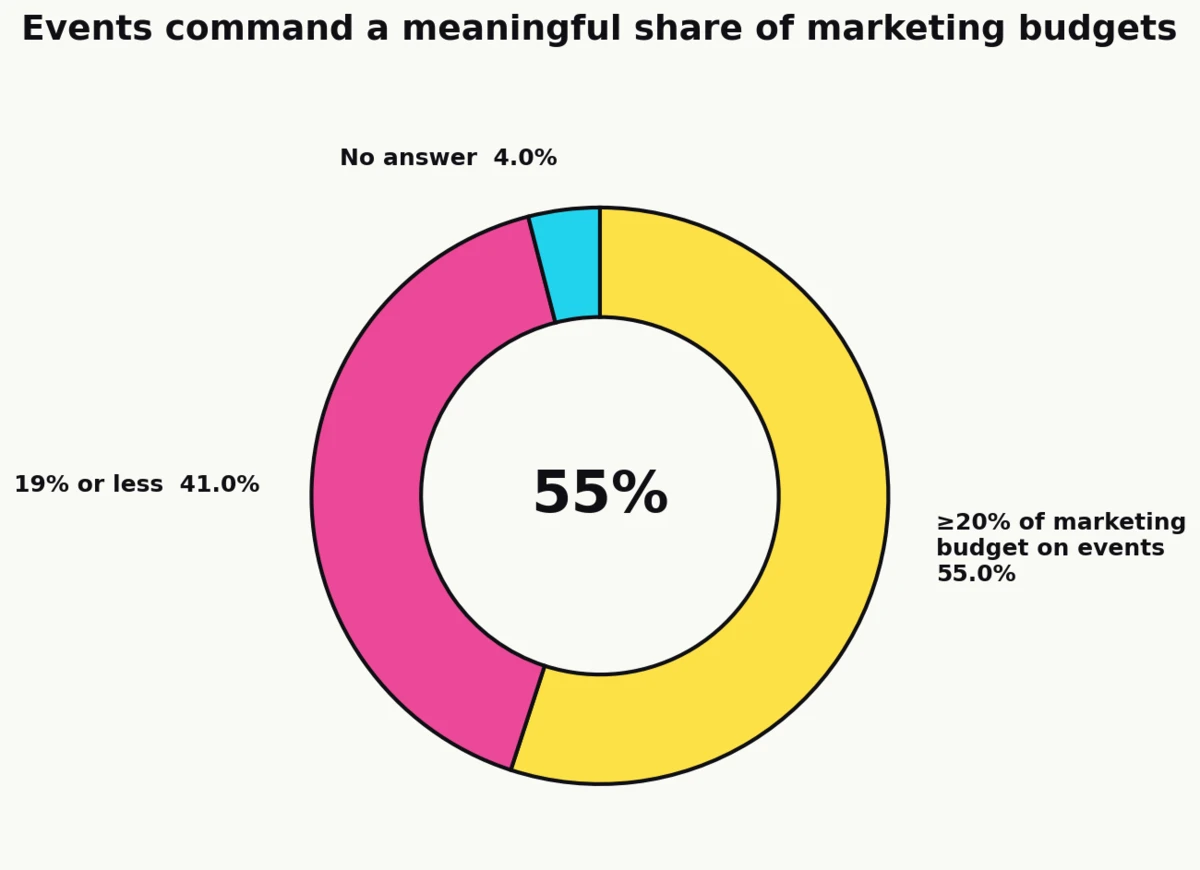
This is a remarkable concentration for a single channel. Display, search, and content each rarely clear that threshold in the same survey cohort.
40% of event organizers expect their events budget to grow in 2026; 40% expect it flat; 20% expect a decrease (Bizzabo)
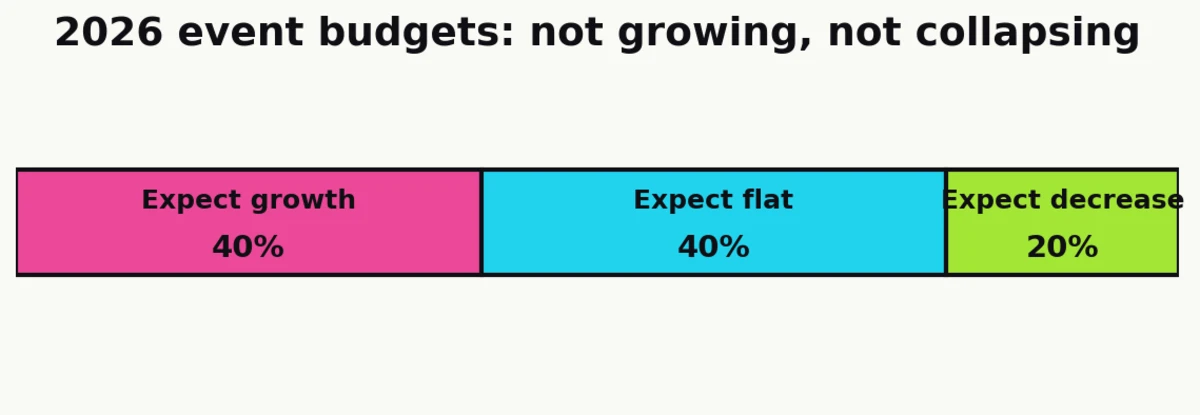
Optimism has moderated from 2025. The split has shifted from growth-dominant to a more evenly distributed outlook, which reads as normalization rather than retreat.
41% of marketers say 19% or less of their total marketing budget goes to events, creating a “lack of budget” challenge (Splash)
Read alongside the 55% who allocate 20%+, the data shows a bimodal industry: the haves are running well-funded programs, the have-nots are trying to get proof of concept before next year’s budget cycle.
23% of marketers spend over 60 hours per event on creating, planning, and hosting (Splash)
Time is the unfunded half of event cost. At even a modest fully-loaded rate of $100 per hour, a 60-hour event costs $6,000 in labor before a single dollar of venue, AV, or catering is spent.
Channel mix: in-person, virtual, and hybrid
Three years after the hybrid experiment went mainstream, the format mix has settled. In-person is not merely back, it is dominant on every revenue metric that organizers track.
63% of events on the Bizzabo platform are in-person, 33% are virtual, and 4% are hybrid (Bizzabo)
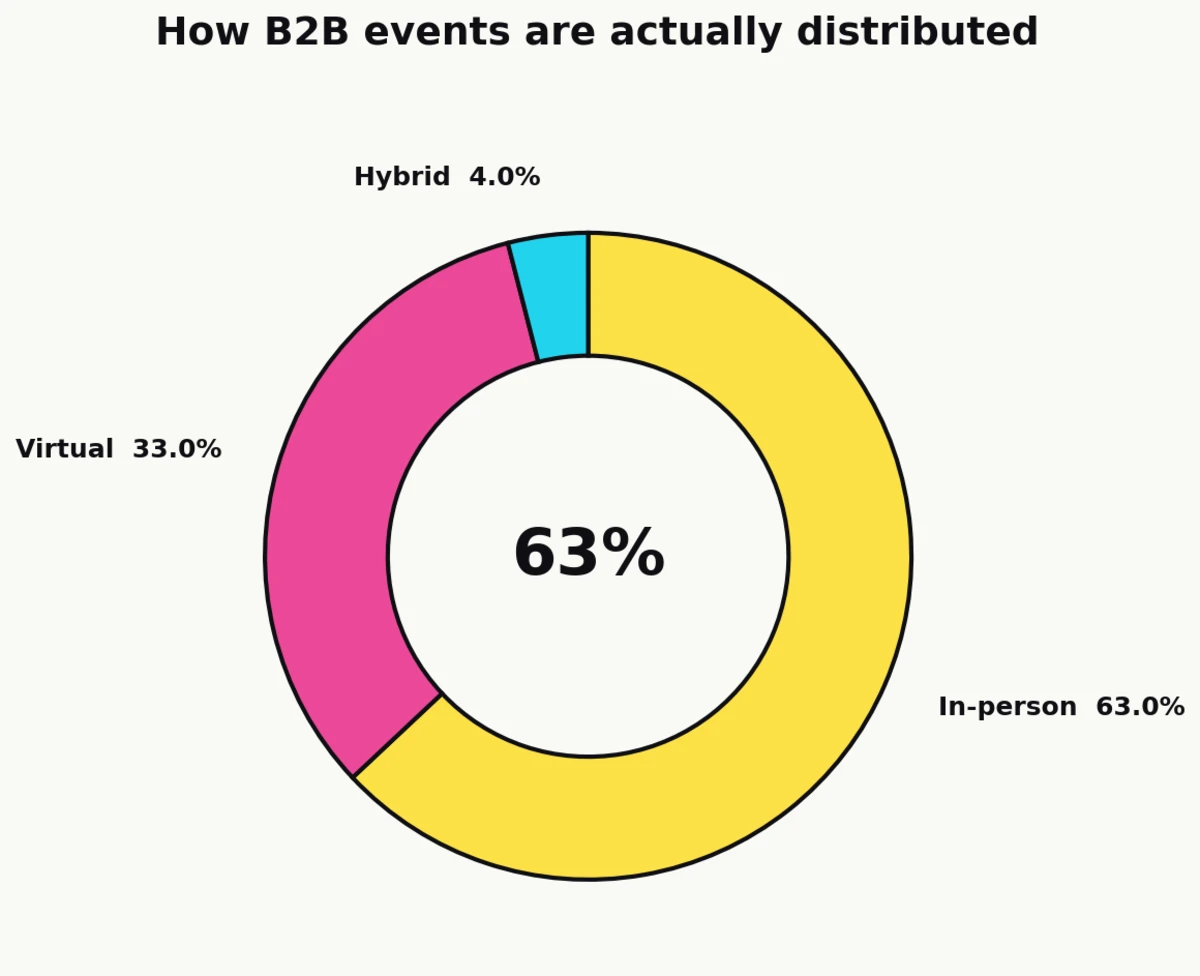
This is platform data, not survey claims, which is rare in this category. Hybrid has effectively failed to establish itself as a first-class format despite three years of pandemic-era hype.
66% of multi-format marketers say in-person events generated the most revenue in 2024 (Splash)
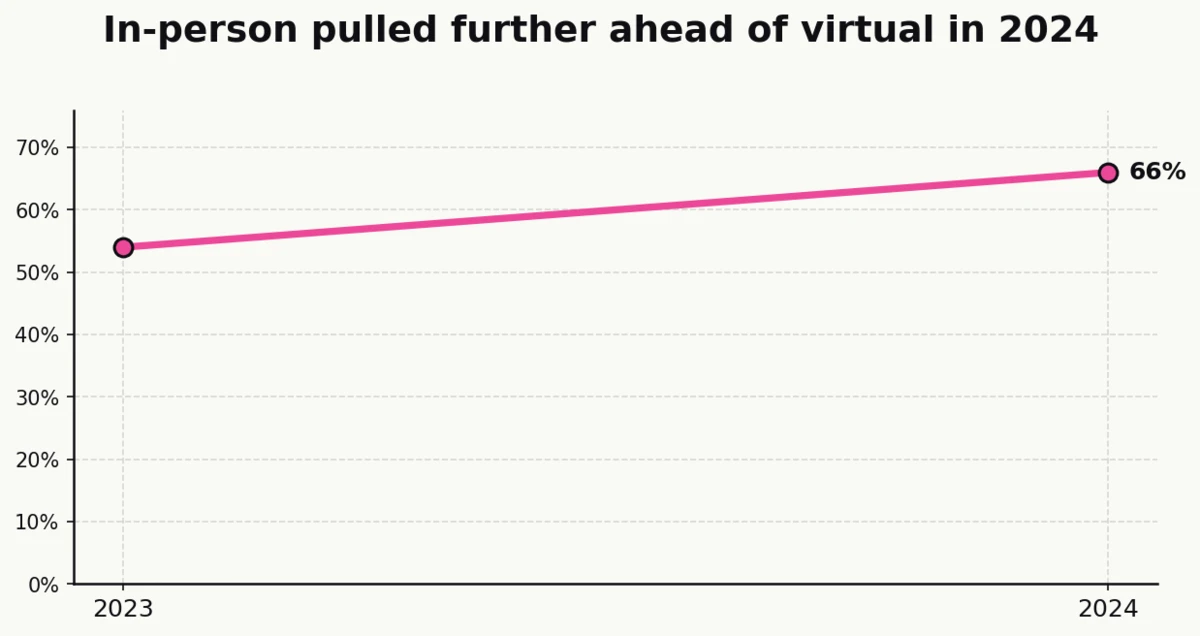
That’s a 12-point increase from those who said the same about their 2023 events. In-person is not just holding the lead, it’s widening it against virtual and hybrid.
78% of event organizers say in-person conferences, summits, and conventions are their organization’s most impactful marketing channel (Bizzabo)
Two publishers, same directional signal: Splash’s marketer survey and Bizzabo’s organizer survey both put in-person at the top of the format-effectiveness ranking.
71% of B2B attendees say in-person conferences offer the most effective way to learn about new products or services (Bizzabo)
The supply and demand sides agree. Marketers invest in-person because attendees learn best in-person.
54% of attendees plan to attend more in-person events than they did last year (Bizzabo)
Growth in attendee intent is the tailwind that matters most for venue operators and activation planners, because budget follows eyeballs.
57% of marketers expect to plan more partner events; 51% more sponsored; 44% more owned (Splash)
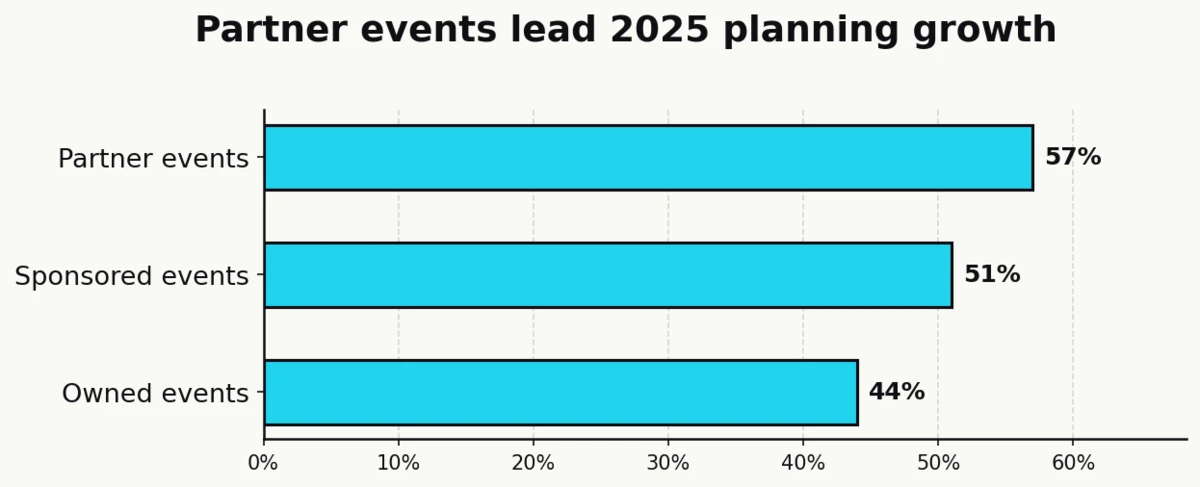
Partner events leading is a meaningful signal for venue operators and multi-location brand owners: their physical footprints can be positioned as partner or sponsored activation opportunities for CPG, fintech, and tech brands looking to allocate against that 57%.
53% of attendees plan to attend more webinars in 2026, and 61% of organizers report increased webinar attendance year over year (Bizzabo)
Virtual isn’t dying, it’s specializing. Webinars work as a top-of-funnel and educational format while in-person takes the revenue crown.
82% of organizers create video-on-demand content from events; 53% gate at least some of it (Bizzabo)
The content leverage of a live event now extends well past its calendar date. More than half of organizers are using that content as a lead magnet.
Technology adoption: event tech, CRM integration, and AI
The stack has shifted from “registration + check-in” to an integrated, AI-augmented layer sitting on top of the marketing automation and CRM. The 2025 and 2026 data show adoption catching up with the rhetoric.
78% of marketers used event technology in the past 12 months, and 88% plan to invest in it in 2025 (Splash)
The 10-point gap between current usage and planned investment is the clearest adoption signal in the report: the channel is still pulling tooling spend forward.
68% of marketers use an event platform that integrates with the rest of their tech stack including their CRM (Splash)
A year later, Bizzabo’s 2026 organizer survey puts the comparable figure at 79%, a double-digit jump that tracks with the general hardening of event-to-CRM plumbing.
79% of organizers have their event platform integrated with CRM or marketing automation tools (Bizzabo)
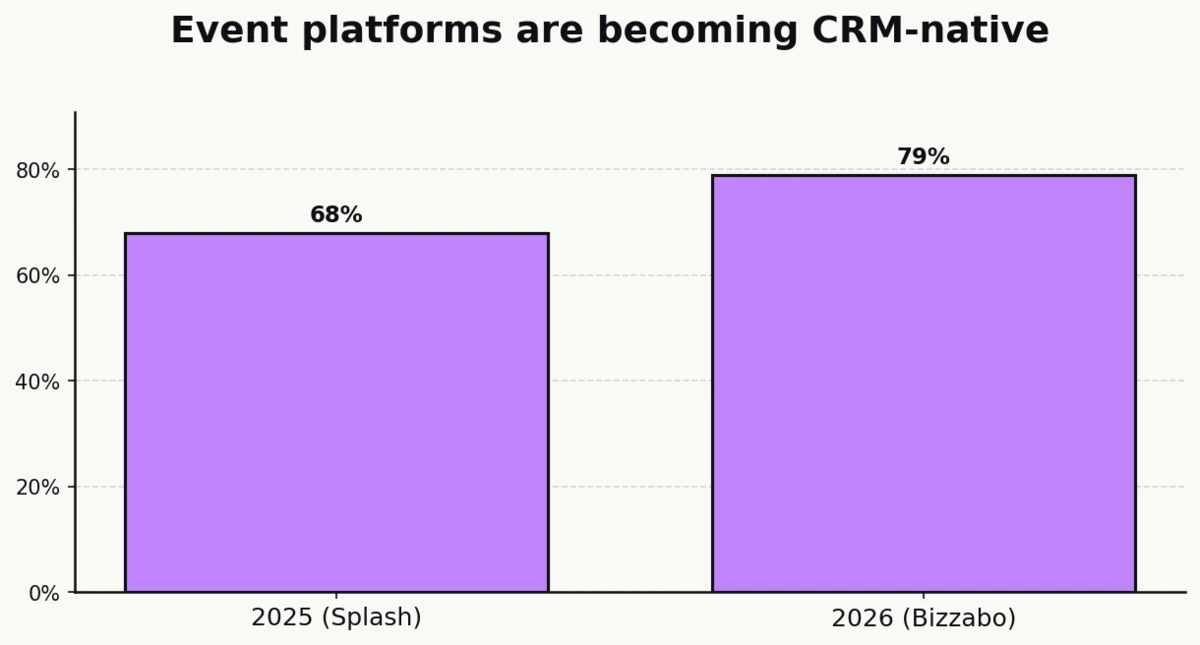
Two publishers a year apart show the same direction and a roughly 11-point gain, which is fast by enterprise-software standards.
95% of event organizers expect their organization’s use of AI in events to increase (Bizzabo)
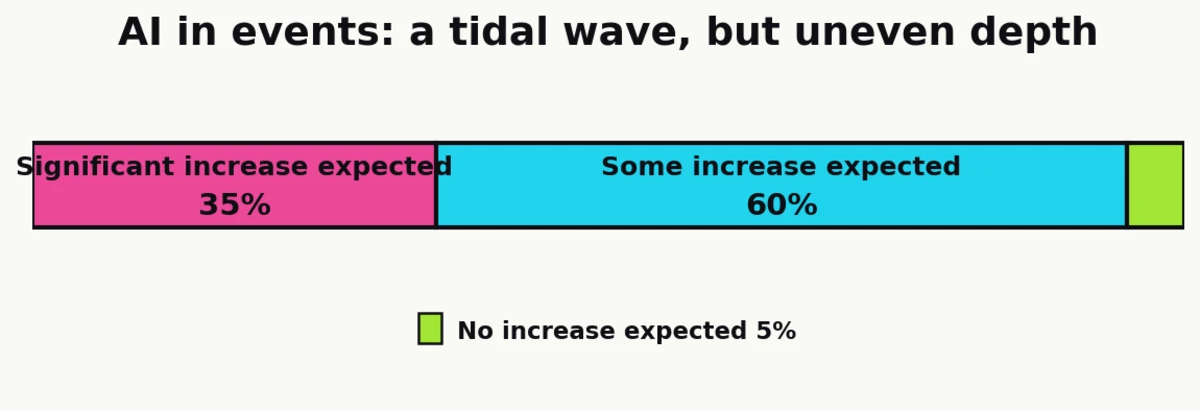
35% anticipate significant increases specifically. The expectation is uniform across the cohort, even if the tooling maturity is not.
37% of marketers don’t know how to effectively use AI in event planning (Splash)
The skill gap is the near-term ceiling on AI adoption. Expectation runs well ahead of capability, which typically predicts a consulting and tooling vendor expansion over the following 18 months.
73% of attendees expect in-person conferences to use modern event technology (Bizzabo)
Attendee baseline expectations set the floor for operator investment. Running a 2026 activation without a mobile app, session polling, or branded capture reads as unprofessional to nearly three quarters of attendees.
55% of attendees say the mobile event app can make or break their experience (Bizzabo)
A binary outcome framing on the app is telling: the app isn’t a feature, it’s the interface for the entire event from an attendee’s point of view.
64% of organizers plan to change their event management software vendor within the next year (Bizzabo)
The figure comes from Bizzabo, an event software vendor, so it carries a commercial angle. The directional signal (high churn, high dissatisfaction) is consistent with the rapid tooling turnover reported across adjacent martech categories.
Brand impact and attendee engagement
The mechanism behind experiential’s revenue outperformance is brand affinity and recall built through live exposure. Independent research agencies like Kadence put concrete numbers on how long that effect lasts and how strong it registers.
91% of people report more positive feelings about a brand after an experiential event (Kadence)
This figure is a measure of positive perception, not recall (a distinction that a number of competing statistics pages get wrong). Kadence aggregates across industry surveys rather than publishing its own primary fieldwork, which is why the number carries a secondary-cross-cited rather than primary-verified tier.
64% of attendees maintain a favorable impression of a brand for a month after attending a live event (Kadence)
Month-long impression retention matters because it matches the typical B2B consideration window. If affinity holds for 30 days, the brand activation can realistically feed the next purchase decision rather than just the next day’s social feed.
95% of organizers say incorporating experiential learning into events is important (Bizzabo)
75% also say immersive experiences that allow attendees to disconnect from their workday are important. Experiential learning and immersion are the two design levers organizers are leaning on to justify live format over virtual alternatives.
Only 15% of organizers rate their networking opportunities as “very effective,” down sharply from 2025 (Bizzabo)
60% rate them as only somewhat effective. Networking is the event’s historical reason-to-exist, and the year-over-year decline is a meaningful gap: attendees came for connection, organizers aren’t consistently delivering it.
47.3% of attendees participate in community features such as chat or discussion spaces, generating 574 messages per event on average (Bizzabo)
Digital community layered onto in-person events is no longer optional. Just under half of attendees engage asynchronously, which means any event platform without a persistent community feature is leaving half the engagement data on the table.
Measurement, attribution, and the math of a real event
The most surprising data point in the 2026 reporting isn’t growth. It’s that measurement is finally working.
40% of organizers report difficulty proving event ROI in 2026, down from 70% in 2025 (Bizzabo)
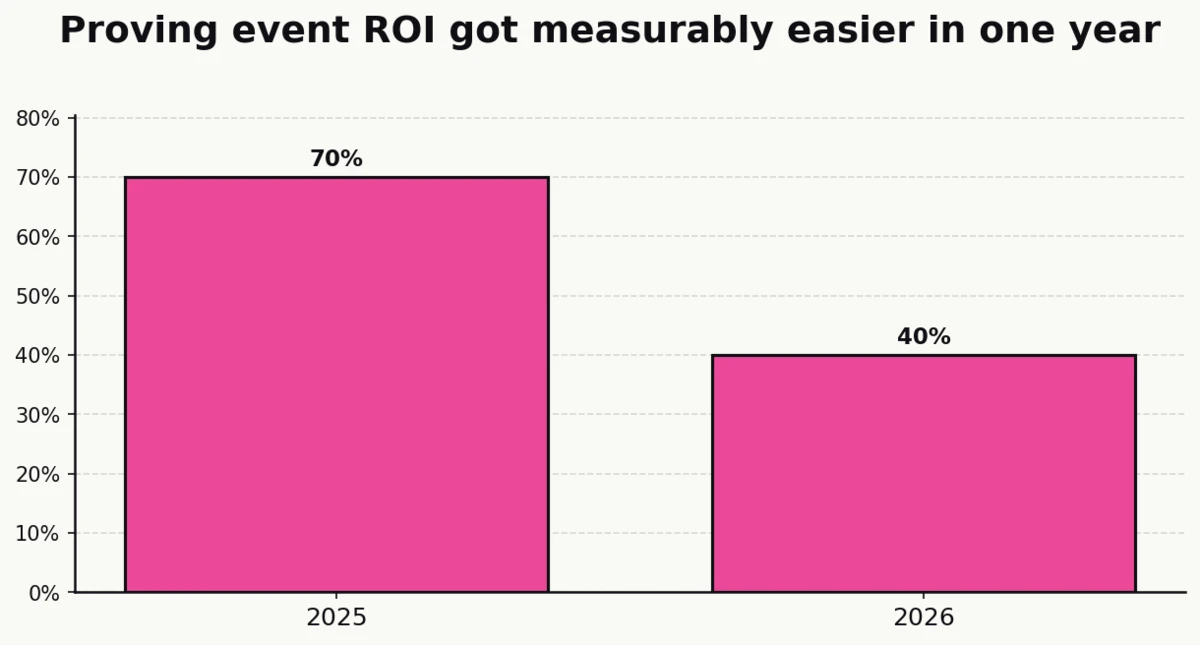
The 30-point year-over-year drop is the single most striking movement in the 2026 dataset. Event ROI measurement was the industry’s perennial Achilles heel; the CRM-integration adoption curve above is the most likely explanation for why it’s finally giving way.
Overall visit-to-registration conversion is 21.5%, with dynamic registration flows converting at 24.4% versus 11.6% for static flows (Bizzabo)
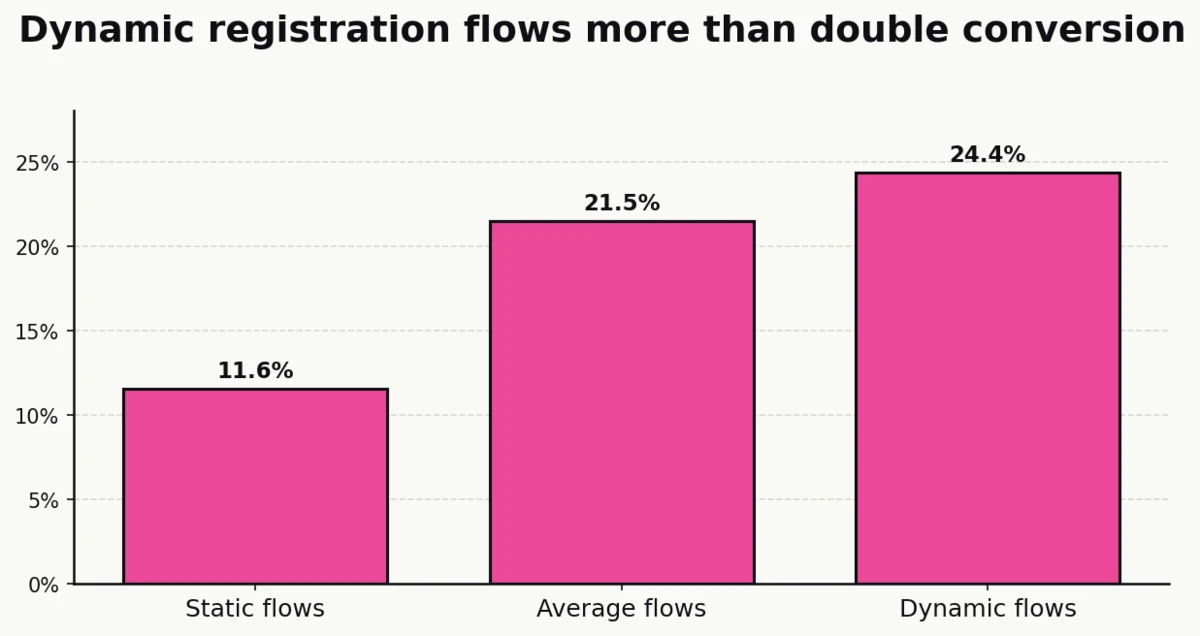
Dynamic flows more than double the conversion rate of static ones. For a 100,000-visit landing page, that’s the difference between 24,400 registrations and 11,600, or roughly 12,800 additional leads at zero additional media spend.
A simple scenario:
| Input | Static flow | Dynamic flow |
|---|---|---|
| Landing page visits | 100,000 | 100,000 |
| Conversion rate | 11.6% | 24.4% |
| Registrations | 11,600 | 24,400 |
| Additional registrations | — | +12,800 |
Marketers track three primary event metrics: registrations (47%), attendance rates (59%), and opportunities created (50%) (Splash)
Opportunities-created sitting at 50% adoption is the maturity signal. A decade ago the dominant event metric was headcount; it is now a pipeline number for half of marketers.
Technology and software marketers are 29% more likely than average to have trouble accurately tracking pipeline generation (Splash)
Travel and hospitality marketers are 43% more likely than average to say they lack an attribution model for company events. Vertical context matters more than it typically gets credit for in aggregate industry reporting.
Virtual session completion averages 71% of total session length, with roughly 46 minutes of viewing per session (Bizzabo)
The 46-minute figure is the benchmark virtual-content creators should be designing against. Sessions longer than that will increasingly test the attention ceiling.
Event-led growth as a strategic frame
Splash’s 2025 Outlook introduces a framework they call event-led growth, or ELG: companies that make events the central rather than supporting channel in their go-to-market. The adoption numbers are high enough to merit a separate section.
67% of marketers used an event-led growth approach in the past year (Splash)
Two thirds of the surveyed marketers now position events at the center of their go-to-market, not the periphery.
Marketers who adopted ELG were 140% more likely to have average company growth above 50% (Splash)
Splash publishes this survey and sells event software, so read the causal implication with appropriate skepticism. The rank-order claim (ELG adopters outperform on growth) is consistent with adjacent data in the Bizzabo 2026 report.
71% of non-ELG marketers say their company would benefit from the approach (Splash)
The recognition gap between current adopters (67%) and those who see the benefit (71% of non-adopters) compresses the 2025 audience for ELG tooling into a single cohort.
48% of non-ELG marketers plan to make events their primary channel for customer acquisition and retention in 2025 (Splash)
Nearly half of the non-adopters expect to cross over within the year. Applied to the current 33% non-ELG base, that implies roughly a 15-point expansion of the ELG cohort by the end of 2025.
Sources: Splash
Key takeaways
The single most citable figure in the 2025-2026 data is this: 72% of marketers say events are their company’s most effective marketing channel, and 52% attribute at least half of closed-won deals to them. The channel that used to compete on brand-lift arguments now competes on attributable revenue, and is winning on both.
The non-obvious pattern is that measurement itself has changed. The year-over-year drop from 70% to 40% in “difficulty proving event ROI” is larger than any single spend or attendance swing in the dataset. The industry has spent a decade saying events attribute; the 2026 reporting is the first year that a majority of organizers say the measurement actually works. CRM integration rates jumping from 68% to 79% in 12 months is the most likely cause.
The second pattern is format polarization. In-person has gone from “the default that can’t scale” to “the format that owns revenue,” with 66% of multi-format marketers crowning in-person the 2024 revenue leader and only 4% of events running as true hybrid. Hybrid, the pandemic-era consensus, has not survived the normalization period. Virtual has specialized around webinars and on-demand content rather than trying to replicate in-person.
The third pattern is staffing. 45% of event teams run with 1 to 3 people, against a benchmark of 25 events per year at the mature end. The operational reality is that most event programs are under-resourced relative to their revenue ambition, which makes tooling adoption (event platforms, AI personalization, CRM integration, attendee apps) less of a discretionary investment than the budget headlines make it look.
For operators, vendors, and marketing leaders setting 2026 plans, the strategic implication is simple: experiential is no longer the channel you defend to the CFO. It’s the channel your CFO expects to see grow. The constraint has moved from budget authorization to attribution quality, staffing capacity, and technology integration, in that order.
Sources
- Bizzabo (2026). “Event Marketing Statistics: 2026 State of Events Report.” https://www.bizzabo.com/blog/event-marketing-statistics
- Forrester (2024). “The Global State of B2B Events: 8 Key Findings from the Forrester 2024 B2B Event Trends Survey.” https://www.forrester.com/blogs/
- Gradient Experiential (2024). Experiential Marketing Survey, reported by Marketing Dive. https://www.marketingdive.com
- Kadence (2024). “The Return of Experiential Marketing and Why It Matters Now.” https://kadence.com
- Marketing Dive (2024). “Experiential Marketing Gains Priority as Companies Increase Budgets.” https://www.marketingdive.com
- Splash / Cvent (2025). “2025 Outlook on Events Report.” https://splashthat.com/resources/2025-events-outlook-report-lp