Industry aggregators, citing PQ Media’s Global Experiential Marketing Forecast, report global experiential spending crossed $128 billion in 2024, the first year the category surpassed pre-pandemic levels. Four in five companies raised their activation budgets over the prior three years, and activations now claim between 10% and 30% of total marketing spend.
The numbers beneath that headline tell a sharper story. Brand recall drives roughly 39% of all brand lift in emerging media, according to Nielsen, and 77% of consumers trust brands more after meeting them in person. What used to be a discretionary line on a CMO’s budget is now structural, with B2B organizers calling live events their most impactful channel and 51% of brand marketers planning to keep growing their experiential spend through 2026.
We pulled the most-cited 2023–2024 spend, trust, recall, opt-in, and ROI benchmarks from primary publishers into one reference page. Every number below links to the publisher that produced it.
Top 9 Brand Activation Statistics (Editor’s Picks)
- $86.66 billion — size of the global brand activation market in 2026, forecast to reach $137.63 billion by 2035 at a 5.28% CAGR.
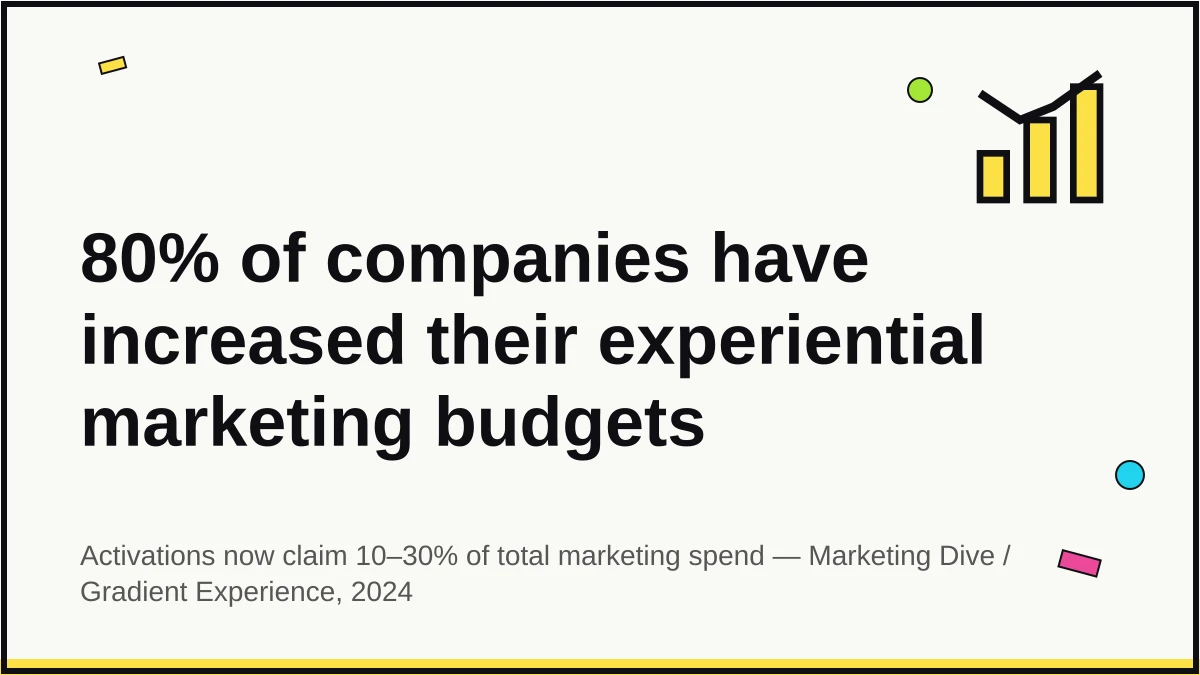
- 80% of companies have increased their experiential marketing budgets over the past three years, with activations now representing 10% to 30% of total marketing spend.
- 80.4% of B2B conference organizers say in-person events are their organization’s most impactful marketing channel.
- 38.7% of all brand lift in emerging media is driven by brand recall, the single largest factor ahead of awareness and message association.
- 77% of consumers say they trust brands more after a face-to-face interaction at a live event.
- 25% to 34% is the typical event ROI range, based on a survey of 200+ marketing professionals.
- 14% of total marketing budgets now flow into event marketing, and 67% of meetings professionals expect their event spend to rise.
- 51% of brand marketers plan to increase their experiential investment between 2024 and 2026.
- $2.2 trillion — projected size of the global events industry by 2028, more than doubling from $887 billion in 2020.
Market Size and Spend
Experiential crossed back above its 2019 peak for the first time in 2024, and the shape of the recovery does not look like the pre-pandemic baseline. Brand activation is taking a larger share of a faster-growing marketing mix, with spend concentrated in categories (beauty, CPG, tech) where physical presence is a differentiator rather than a nice-to-have.
The definitional range is wide. Forecast bodies disagree about what counts as “brand activation” versus “experiential marketing” versus “sponsorship activation,” so published market-size numbers span orders of magnitude. The direction is consistent even when the absolute figures diverge.
Global experiential marketing spending crossed $128.4 billion in 2024, the first year it surpassed pre-pandemic levels (G2)
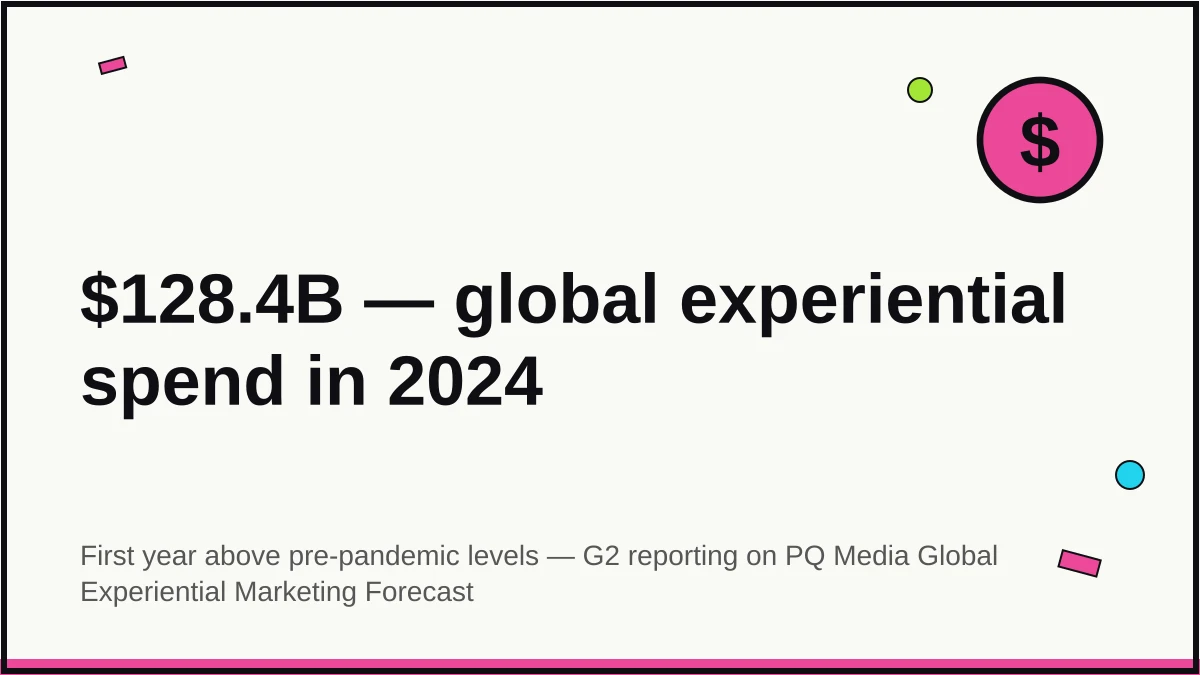
Industry aggregators, citing PQ Media’s paywalled Global Experiential Marketing Forecast, put 2024 global experiential spend at $128.4 billion, the first year the category topped its 2019 peak. The figure is repeated across Marketing Dive, Event Marketer, and Cosmetics Design, but the underlying PQ Media report is not publicly accessible for line-level verification, so treat it as a consolidated aggregate rather than a first-hand datapoint.
The spend is heavily consumer-facing. B2C companies accounted for roughly $90.3 billion in 2024, a 10.3% year-over-year gain, while B2B activations contributed about $38 billion, up 11% year-over-year.
The United States accounts for 45.5% of global experiential marketing spend (G2)
Within the global total, North America leads. Secondary reporting of PQ Media’s regional breakdown places the U.S. share at 45.5% of global spend, roughly $52.8 billion in 2023. Europe and Asia-Pacific together account for most of the remainder, with Latin America and MEA as smaller but faster-compounding segments.
The global brand activation market is forecast to grow from $86.66 billion in 2026 to $137.63 billion by 2035 (Business Research Insights)
Business Research Insights models the brand activation services market at $86.66 billion in 2026, projected to reach $137.63 billion by 2035 on a 5.28% compound annual growth rate. Competing forecasts bracket the same category differently depending on whether “activation” is scoped narrowly (branded experiences only) or broadly (experiential plus sponsorship activation plus pop-up retail combined), which is why market-sizing headlines in this category need a scope note attached.
The direction is consistent across scopes. Every major forecast published since 2023 shows activation compounding faster than the overall marketing services market.
The global events industry is projected to reach $2.2 trillion by 2028, up from $887 billion in 2020 (Statista)
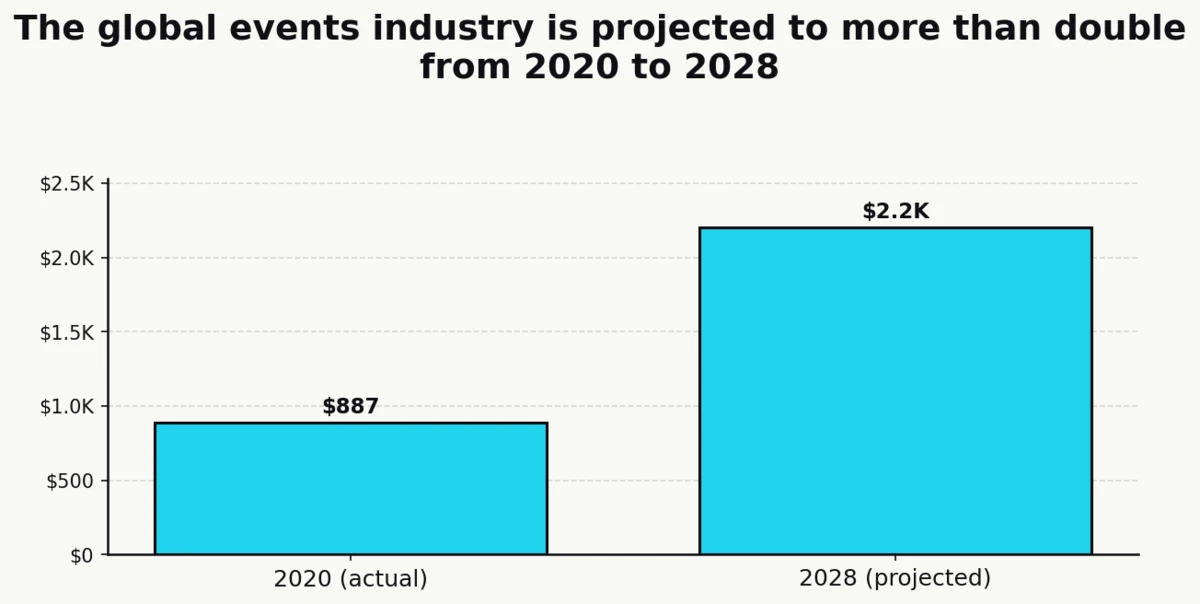
Brand activation sits inside a much larger container. Statista’s events industry market outlook projects global revenue of $2.2 trillion by 2028, versus $887 billion in 2020, a compound doubling within a single marketing planning cycle. Activations follow events, and the container’s growth is the tailwind.
80% of companies have increased their experiential marketing budgets, with activations now claiming 10 to 30% of total marketing spend (Marketing Dive)
Marketing Dive’s reporting on Gradient Experience’s 2024 survey of 750 senior brand marketers and 15 C-suite executives found that 80% of companies raised experiential budgets in the past three years. Another 81% of cross-industry brands report experiential budget increases specifically in that period, putting the shift well past “directional” and into structural-reallocation territory.
The share is heaviest in categories where a product has to be tried to be believed. Beauty, skincare, and CPG marketers report the largest allocations, which tracks with what budget data from PQ Media and Amex GBT show at the industry level.
84% of beauty and skincare companies increased their experiential budgets over the last three years (Gradient Experience)
In the vertical slice Gradient Experience published from its 2024 research wave, 84% of beauty and skincare companies raised experiential budgets over the prior three years, the highest share of any sector Gradient measured. The reason is structural: beauty relies on sampling, texture, scent, and shade-matching, all of which are physical-first signals that digital channels can approximate but not replace.
14% of total marketing budgets are now allocated to event marketing (Amex GBT)
American Express Global Business Travel’s 2024 Global Meetings & Events Forecast, based on a survey of 500+ meetings professionals, puts the average event-marketing line at 10% to 14% of total marketing budgets. The same report finds that 67% of meetings professionals expect their event spend to rise, with 13% anticipating increases of more than 10% year-over-year.
The share itself is less interesting than its momentum. Every incremental point of budget that shifts from digital display or print into live activation is a point that has to produce measurable outcomes to defend itself next cycle.
51% of brand marketers plan to increase experiential investment between 2024 and 2026 (AnyRoad)
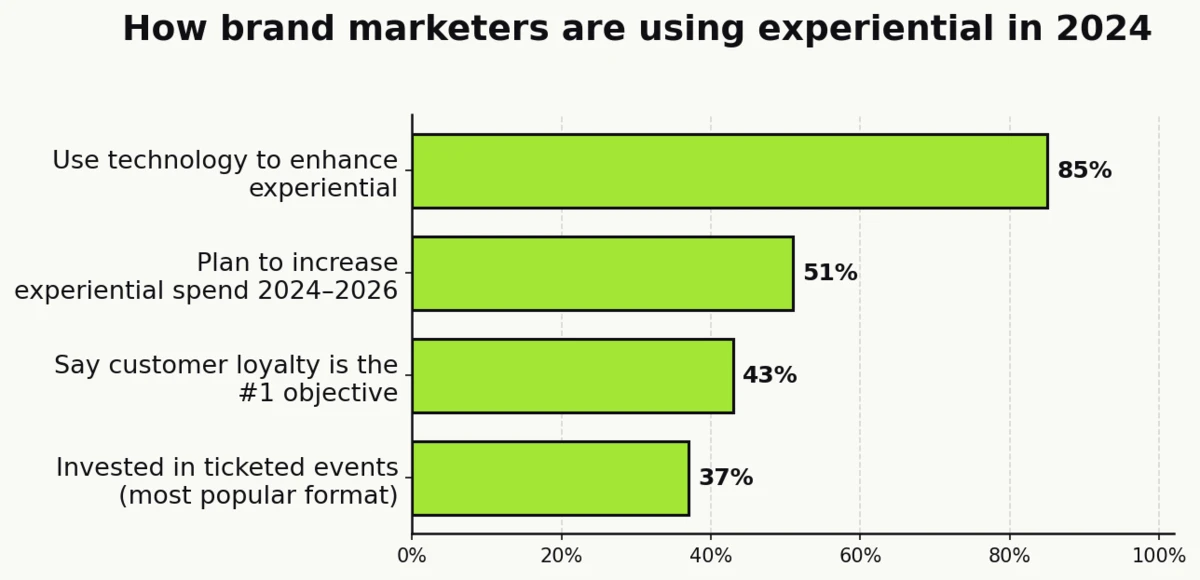
AnyRoad’s 2024 State of Experiential Marketing report, drawn from 73 enterprise brand marketers surveyed in late 2023, finds that 51% plan to raise experiential spend through 2026. When asked what the spend is for, 43% named increasing customer loyalty as their top objective, ahead of acquisition, awareness, or short-term sales lift.
Sources: G2, Business Research Insights, Statista, Marketing Dive, Gradient Experience, Amex GBT, AnyRoad
Live Events and Brand Trust
The reason experiential crossed back above pre-pandemic spend is not nostalgia. Face-to-face interaction produces brand outcomes that digital channels do not, and the measurement has gotten sharper as research firms started instrumenting live activations with the same discipline as paid media.
80.4% of B2B conference organizers say in-person events are their organization’s most impactful marketing channel (Bizzabo)
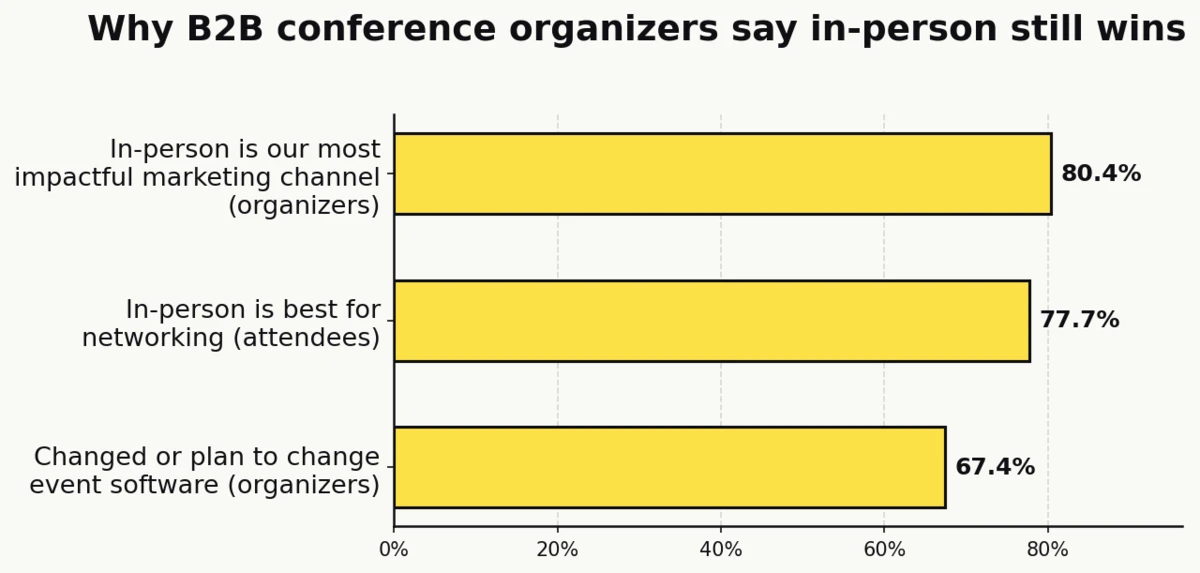
Bizzabo’s 2023 State of In-Person B2B Conferences found that 80.4% of organizers rank in-person events above every other channel they run, including content, paid search, digital advertising, and social. In the same survey, 77.7% of attendees said in-person B2B conferences are best for networking, which is the mechanism the organizer stat is picking up.
B2B buying happens in rooms. A conference-room conversation with a shortlisted prospect closes faster than six months of digital nurture, and organizers’ self-reported channel rankings reflect that.
77% of consumers trust brands more after a face-to-face interaction at a live event (Freeman)
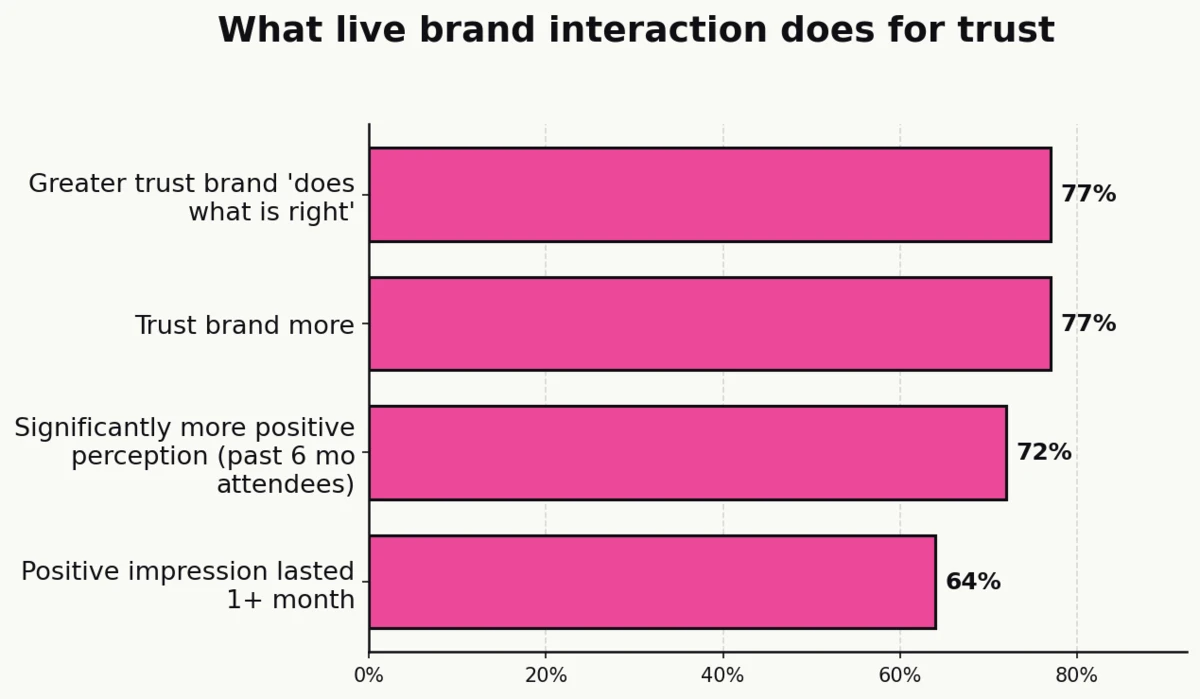
The Freeman Trust Report 2023, conducted by Edelman Data and Intelligence, found 77% of all respondents, and more than 8 in 10 millennials, trust brands more after interacting with them face-to-face. In the same research, 72% of consumers who attended an event in the prior six months were significantly more likely to have positive perceptions of the brand, and another 77% left with greater confidence that the brand would do what is right.
Three distinct trust measures, one causal story: physical encounter shifts brand perception in a way screens do not.
The brand-trust halo from a live event lasts at least a month for 64% of consumers (Freeman)
The same Freeman research found the halo effect has a durable tail. For 64% of consumers, the positive trust lift from a live event interaction persists at least a month after the encounter.
That tail is what makes activations budget-defensible. A TV impression decays within hours; a live interaction keeps paying for weeks, which changes the attribution math CMOs present to CFOs.
Spring 2023 in-person event attendance was 23% higher than pre-pandemic 2019 and 34% higher than 2022 (Cvent)
Cvent’s 2023 North America Planner Sourcing Report, based on platform-observed attendance data rather than self-report, found spring 2023 in-person attendance 23% above spring 2019 and 34% above spring 2022. The recovery isn’t just back to baseline, it’s above it.
Because the Cvent number is platform-observed (pulled from booking and registration flows, not marketer self-report), it cuts through the optimism bias that inflates survey-based recovery numbers.
79% of meetings and events in 2024 are either fully in-person or hybrid (Amex GBT)
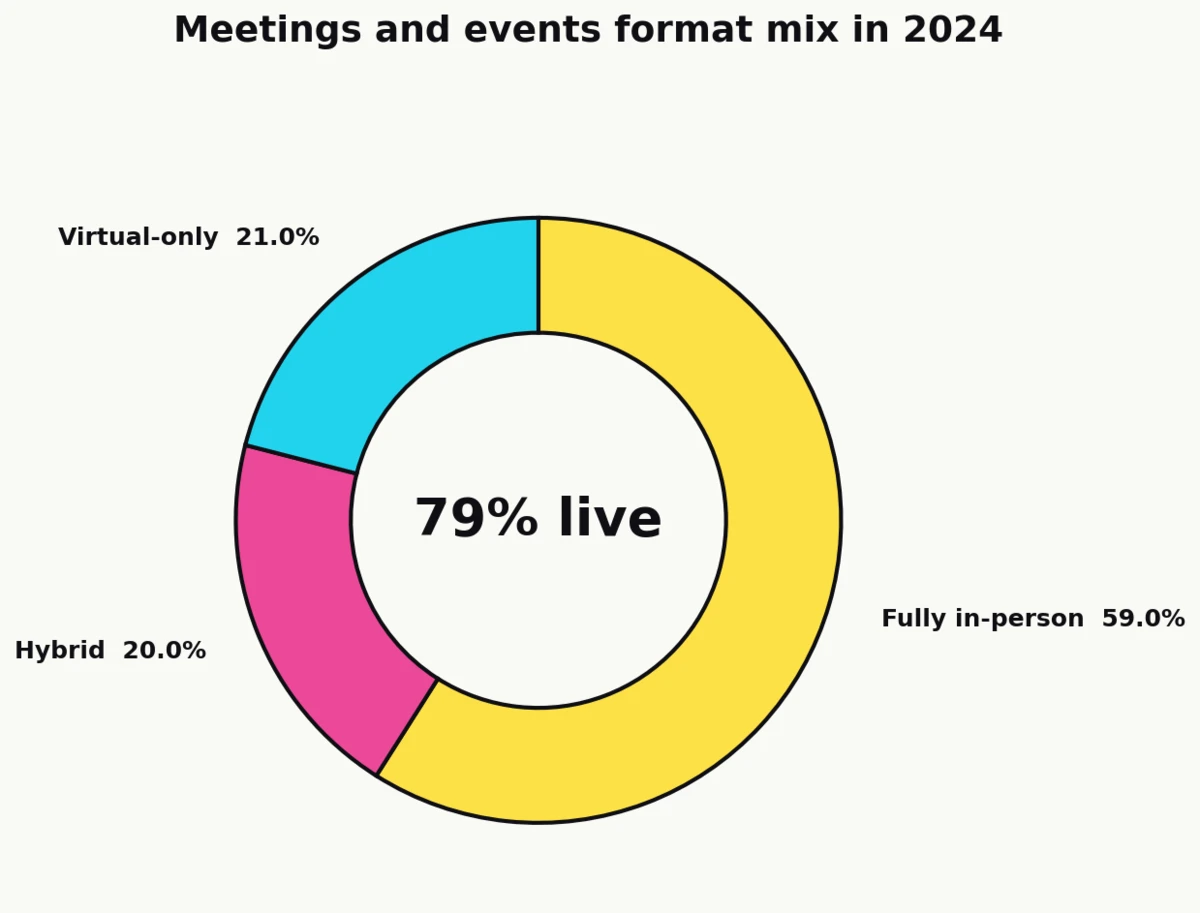
Amex GBT’s 2024 Global Meetings & Events Forecast shows the format mix has settled. 59% of events are fully in-person, 20% are hybrid, and just 21% are virtual-only. Alongside that, 82% of meetings and events professionals report being optimistic about the industry in 2024, up five points year-over-year.
The virtual-only cohort has not disappeared, but it has stabilized at a small fraction of the mix.
73% of the events marketers ran in 2023 were in-person (Splash)
Splash’s 2024 Event Marketing Outlook, drawn from a survey of 1,255 U.S. and U.K. marketers conducted in late December 2023, found 73% of the events marketers ran that year were in-person. 69% planned to run more events in 2024, and 70% planned to raise their event budgets. Splash is a vendor-published survey, but the sample size makes it the deepest marketer-side view currently in the public record.
Sources: Bizzabo, Freeman, Cvent, Amex GBT, Splash
Brand Recall, ROI, and Measurement
Spend without measurement is theater. What changed between 2019 and 2024 is the quality of the measurement. Recall, lift, and incremental revenue attribution moved from agency-only dashboards into the standard CMO stack. The published ROI range has tightened, but the gap between the best-instrumented programs and the rest is now the structural divider.
Brand recall drives 38.7% of all brand lift in emerging media, the single biggest factor (Nielsen)
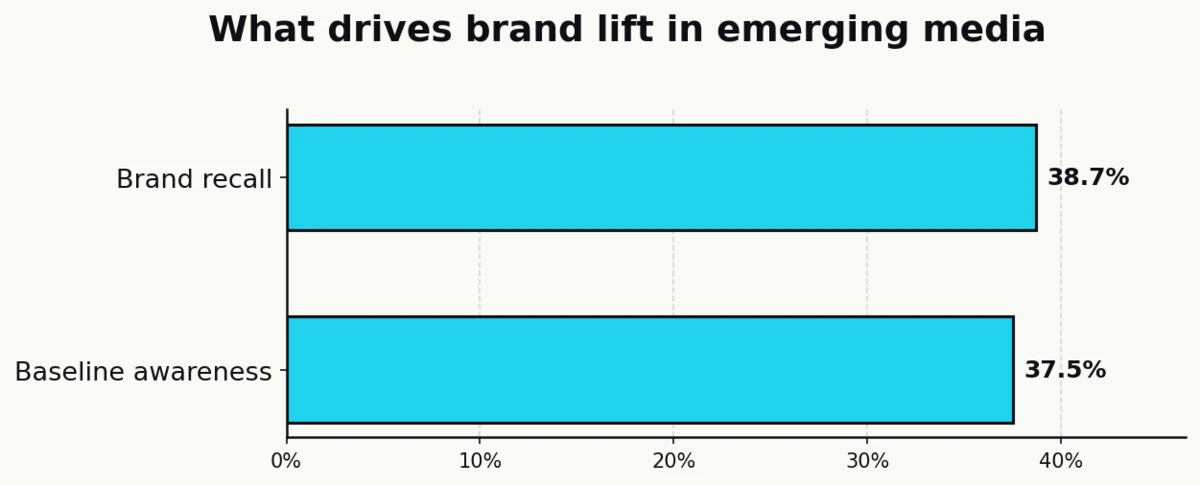
Nielsen’s 2023 analysis of more than 1,000 podcast, influencer, and branded marketing campaigns from its Brand Impact Norms database found that brand recall accounted for 38.7% of total brand lift, just ahead of baseline awareness at 37.5% and well ahead of message association and funnel metrics.
Nielsen’s scope was “emerging media” (podcast, influencer, branded content), not live activation specifically, but the mechanism carries over. Recall is the bridge between a brand interaction and a later purchase decision. Well-designed activations are effectively recall-engineering on a compressed timeline, which is why the Nielsen number is the most transportable single stat in the category.
Typical event ROI ranges between 25% and 34%, based on a survey of 200+ marketing professionals (Marketing Charts)
Marketing Charts’s survey of 200+ B2B marketing professionals, drawing on underlying Bizzabo benchmark data, places the typical event ROI range at 25% to 34%. Within that range, program size and instrumentation matter: mid-market programs cluster toward the lower end, while F500 activations with multi-touch attribution and instrumented data capture can exceed it.
The variance is the story. Top-quartile operators are measuring multi-touch attribution, pre/post recall lift, and on-site opt-in conversions as distinct signals. The bottom quartile is guessing.
61% of B2B marketers and 70% of B2C marketers struggle to prove the value of experiential to the C-suite (Agency EA)
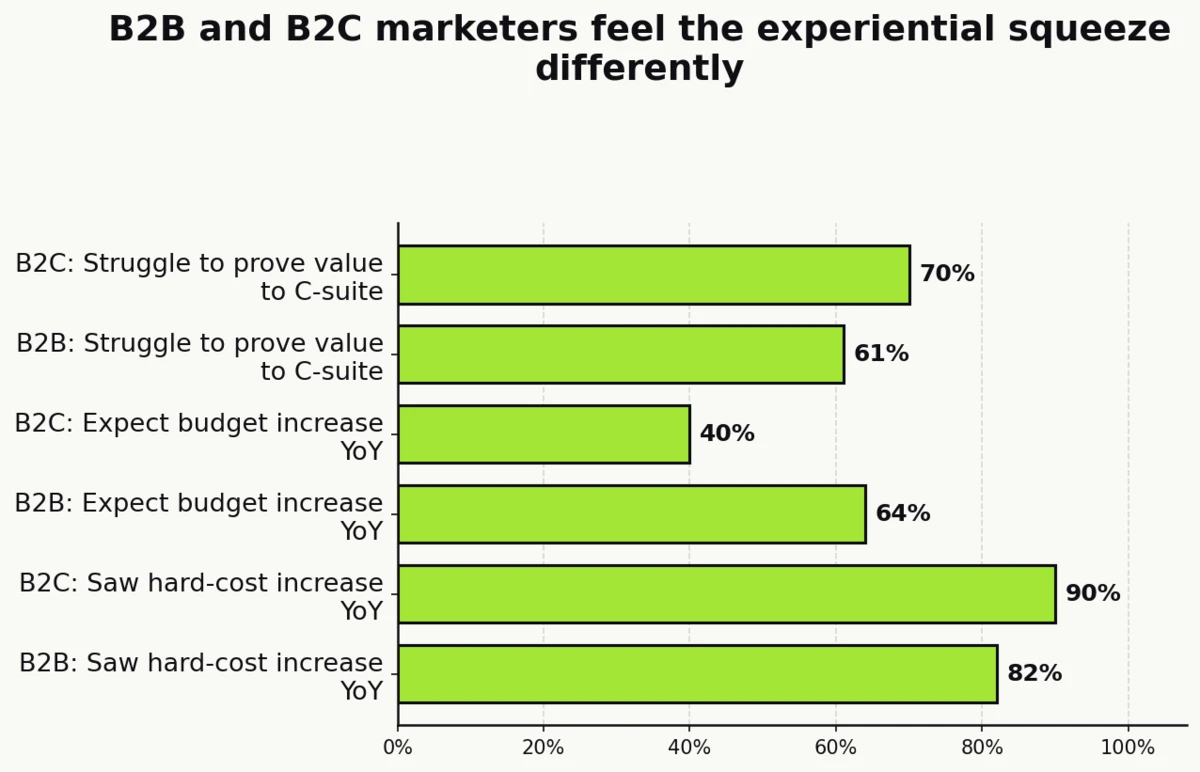
Agency EA’s 2023 State of Experiential Research Study, based on 100+ experiential professionals across brand, agency, and vendor sides, surfaces the measurement gap in sharp relief. 61% of B2B and 70% of B2C marketers say they struggle to prove experiential value to the C-suite. In the same survey, 82% of B2B and 90% of B2C respondents reported year-over-year increases in hard costs.
That combination forces a decision: instrument the measurement, or lose the budget. The Agency EA data is the strongest single piece of evidence that measurement maturity (not spend level) is what separates programs that keep their budget from programs that lose it.
64% of B2B marketers expect their experiential budget to grow year-over-year (Agency EA)
Despite the measurement difficulty, Agency EA’s survey finds 64% of B2B marketers expect their experiential budget to rise, alongside 40% of B2C marketers. The B2B bias is explained by account-based economics. In complex, high-ticket sales, a single closed deal from a live event can justify an entire year’s activation budget on its own.
Sources: Nielsen, Marketing Charts, Agency EA
Attendee Behavior and On-Site Opt-In
The best activations convert a four-minute dwell into a tracked marketing asset. Attendee behavior (willingness to pay, content creation, repeat visits) is where the opt-in math and post-event amplification value actually compound.
79% of consumers would pay more to attend events that feel meaningful or transformative (Eventbrite)
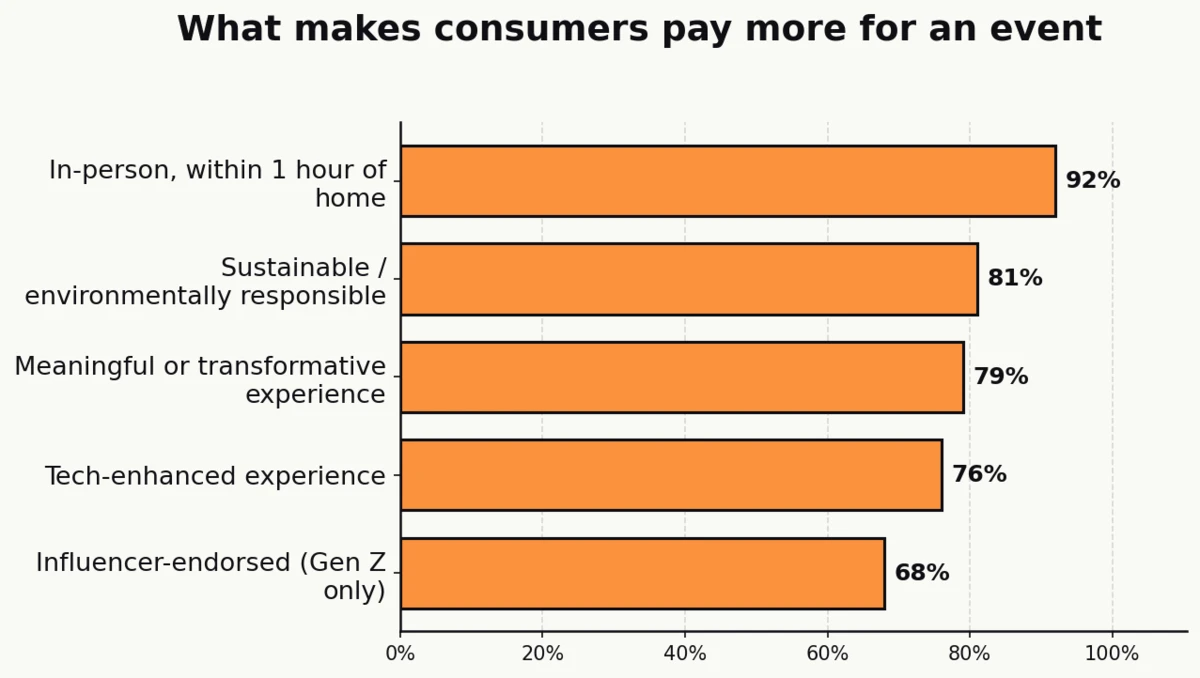
Eventbrite’s TRNDS 2024 report, conducted with MarketCast across 1,999 U.S. event organizers and attendees, found that 79% of consumers say they would pay more for events that feel meaningful or transformative. The travel radius is tight: 92% prefer in-person events over virtual within one hour of home.
Proximity matters more than screen time. When an activation is physically accessible, attendance preference flips decisively against virtual formats.
60% of hybrid-event hosts say in-person gatherings are most effective for driving revenue (Splash)
Among the marketers running hybrid programs in Splash’s 2024 Outlook, 60% name in-person gatherings as their most effective revenue driver. Paired with the 70% who plan to raise event budgets in the same survey, the signal is unambiguous: live is where the measurable money flows, and budget is following the measurement.
Sources: Eventbrite, Splash
Activation Formats and Technology
Technology is what turns a four-minute interaction into a trackable marketing asset. Data capture, on-site software, and AI are the infrastructure that closes the measurement gap between activations and paid media.
85% of brand marketers use technology to enhance their experiential campaigns (AnyRoad)
AnyRoad’s 2024 report found 85% of brand marketers use technology to enhance their experiential campaigns. The tech layer is not optional anymore, it’s the measurement backbone. Pressure on that stack is intensifying: 60% of B2C and 59% of B2B marketers cite internal team and resource constraints as their single biggest experiential challenge, which is why turnkey activation platforms have been compounding share.
Format mix data from Agency EA and AnyRoad shows the most-invested formats in 2023. Sporting events led at 51%, followed by festivals at 39%, sponsorships at 38%, ticketed events at 37% (the single most-invested event type per AnyRoad), pop-ups at 36%, community events at 33%, and product sampling at 26%.
67.4% of event organizers changed or plan to change their event software (Bizzabo)
Bizzabo’s 2023 State of In-Person B2B Conferences surfaces a stack in transition. 67.4% of organizers have changed or plan to change their event software. The churn reflects a generational shift. First-generation event tech, bought in a rush during the 2020–2022 virtual pivot, is getting swapped out for platforms that handle in-person, hybrid, and data-capture together in one stack.
76% of consumers would pay more to attend tech-enhanced events (Eventbrite)
Eventbrite’s TRNDS 2024 data shows 76% of consumers would pay more for tech-enhanced events. Among Gen Z, 68% say they would pay more for events endorsed by influencers, a preference that compounds with the tech-premium signal and explains the accelerating AR and on-site personalization investment.
56% of B2B marketers using generative AI plan to expand its use at in-person events (LinkedIn)
The LinkedIn B2B Benchmark Report 2023 found 56% of B2B marketers currently using generative AI plan to increase its use at in-person events. That’s the earliest-to-market indicator of where the event tech roadmap is heading: AI is shifting from behind-the-scenes list generation and copy drafting to attendee-facing personalization (real-time matchmaking, on-site recommendations, post-event follow-up compression).
Sources: AnyRoad, Bizzabo, Eventbrite, LinkedIn
Sustainability and Purpose-Driven Activations
Sustainability has moved from a line in the RFP to a measurable driver of attendance, sponsor selection, and pricing power. The shift happened fast: in 2019, sustainability was a footnote. In 2024, it’s in the procurement checklist.
31% of event planners include sustainability requirements in their RFPs in 2024, up from 14% in 2019 (PCMA)
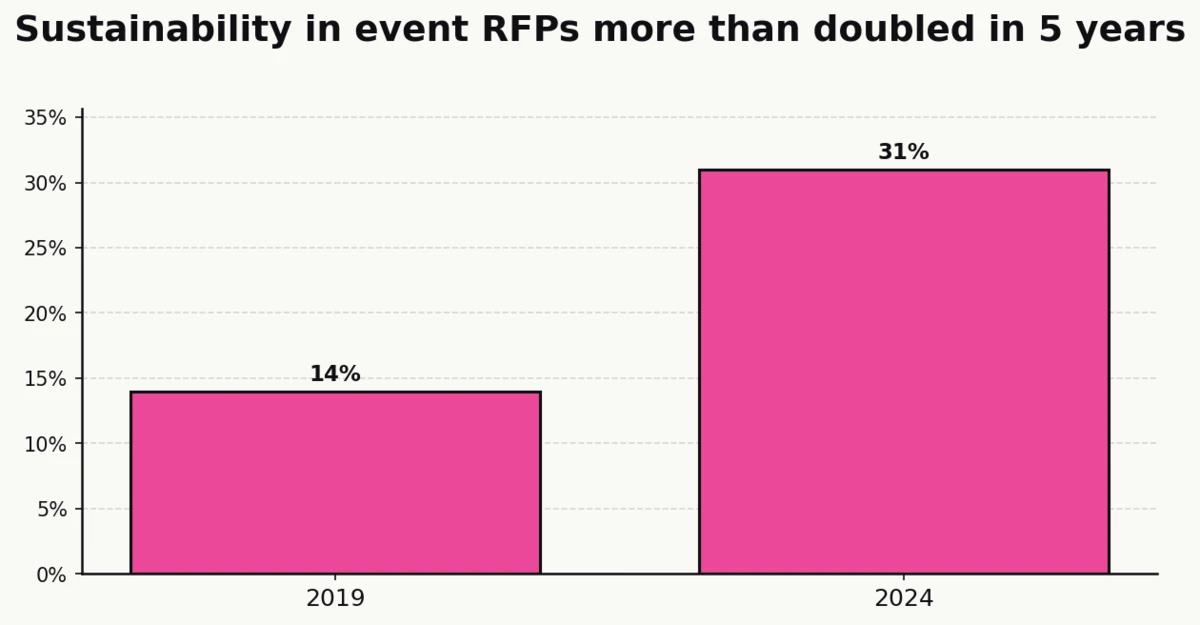
PCMA’s Convene 30th Meetings Market Survey, which drew responses from nearly 790 event professionals in late 2023, found that 31% of planners now include sustainability requirements in RFPs. That’s up from 14% in 2019, a 121% increase in five years and one of the steepest behavioral shifts in the category.
Beyond the RFP line, 28% of respondents have created an internal sustainability policy, and 27% have increased sustainability reporting to attendees or internal stakeholders.
60% of event planners are now more intentional about green event design than they were before the pandemic (PCMA)
In the same Convene survey, 60% of planners report being more intentional about designing events with green initiatives than they were pre-pandemic. The momentum is professional, not just consumer-driven. Procurement teams, CFOs, and investor-relations groups now treat event sustainability as a reported metric, not a soft preference.
45% of event professionals say sustainability is a relevant meetings trend (Knowland)
Knowland’s 2024 State of the Meetings Industry, based on 326 event professionals (63% associations, 31% corporate bookers), found 45% name sustainability as a relevant meetings trend. Reported via PCMA’s Pulse Check, the Knowland figure sits alongside the RFP and design-intention data as independent confirmation that the sustainability shift is industry-wide rather than concentrated in any single segment.
Consumers say they are willing to pay a 9.7% premium for sustainably produced or sourced goods (PwC)
PwC’s 2024 Voice of the Consumer Survey, drawn from 20,000+ consumers across 31 countries, measured the willingness-to-pay premium for sustainable goods at 9.7%. That’s a harder, more defensible number than the “80% would pay more” figures floating across agency listicles. It is specifically monetized: almost ten percent of unit price is the sustainability premium consumers will tolerate before substituting down.
Key Takeaways
Global experiential spend crossed $128 billion in 2024 for the first time since the pandemic, and the direction is structural rather than cyclical. Eighty percent of companies now allocate 10% to 30% of marketing budget to live activation, and the line item has survived two annual planning cycles since the COVID disruption. That’s what turns a trend into a category.
The second signal is measurement maturity. Nielsen’s finding that brand recall drives 38.7% of brand lift in emerging media is the mechanism that makes activations CFO-defensible, but Agency EA’s data shows 61% to 70% of marketers still cannot prove experiential value to their C-suite. The divide between top-quartile operators (with instrumented opt-in, pre/post recall studies, and post-event attribution) and the rest is now the structural variable in whether a brand keeps or loses its experiential budget.
Third, attendee expectations have compressed around meaning and technology simultaneously. Eventbrite’s TRNDS data shows 79% of consumers will pay more for meaningful or transformative experiences and 76% will pay more for tech-enhanced events. PCMA’s sustainability tracking (14% of RFPs in 2019, 31% in 2024) shows the procurement side has caught up. Sustainability is a line item now, not a preference.
For CMOs and brand leaders planning 2026 activation budgets, three priorities follow from the data. Instrument the measurement stack so the ROI conversation becomes quantitative rather than anecdotal. Treat the activation’s four-minute dwell as a content and data asset, not an ephemeral interaction. And design for the sustainability and tech-enhancement signals the RFPs now require, because the procurement checklist has already moved past where most agency decks are.
The brands that treat activation as a measurement discipline, not just a creative one, are the brands that will still have the line item in 2027.
Sources
- Agency EA (2022). “2023 State of Experiential Research Study Forecasts Industry Trends for the Year Ahead.” https://www.prnewswire.com/news-releases/agency-ea-releases-results-from-2023-state-of-experiential-research-study-forecasts-industry-trends-for-the-year-ahead-301697567.html
- American Express Global Business Travel (2024). “2024 Global Meetings & Events Forecast.” https://www.amexglobalbusinesstravel.com/meetings-events/me-forecast/
- AnyRoad (2024). “State of Experiential Marketing 2024 Report.” https://www.anyroad.com/2024-report
- Bizzabo (2023). “State of In-Person B2B Conferences 2023.” https://welcome.bizzabo.com/in-person-conferences-state-report-2023
- Business Research Insights (2026). “Brand Activation Market Report.” https://www.businessresearchinsights.com/market-reports/brand-activation-market-118014
- Cvent (2023). “Annual Cvent Planner Sourcing Report, North America Edition.” https://www.cvent.com/en/resource/hospitality/annual-cvent-2023-planner-sourcing-report-north-america-edition
- Eventbrite (2024). “TRNDS 2024 Event Statistics Report.” https://www.eventbrite.com/blog/event-statistics-ds00/
- Freeman (2023). “Freeman Trust Report 2023.” https://www.freeman.com/about/press/freeman-trust-report-2023/
- G2 (2025). “Experiential Marketing Statistics” (citing PQ Media Global Experiential Marketing Forecast). https://learn.g2.com/experiential-marketing-statistics
- Gradient Experience (2024). “84% of Beauty Skincare Companies Increased Experiential Budgets Over the Last 3 Years.” https://www.gradientexperience.com/insights/84-of-beauty-skincare-companies-increased-experiential-budgets-over-the-last-3-years
- Knowland (2024). “State of the Meetings Industry 2024” (reported via PCMA Sustainability Pulse Check). https://www.pcma.org/sustainability-pulse-check-events/
- LinkedIn Marketing Solutions (2023). “The B2B Benchmark Report 2023.” https://business.linkedin.com/content/dam/me/business/en-us/amp/marketing-solutions/images/lms-state-of-b2b-marketing/pdf/the-b2b-benchmark-report-2023-final.pdf
- Marketing Charts (2023). “Event ROI Benchmark Survey.” https://www.marketingcharts.com/industries/business-to-business-93097
- Marketing Dive (2024). “Experiential Marketing Spending Surpasses Pre-Pandemic Levels in 2024.” https://www.marketingdive.com/news/experiential-marketing-spending-surpasses-pre-pandemic-levels-2024/730031/
- Nielsen (2023). “In Emerging Media, Brand Recall is the Biggest Driver of Lift.” https://www.nielsen.com/insights/2023/in-emerging-media-brand-recall-is-the-biggest-driver-of-lift/
- PCMA (2024). “Sustainability Pulse Check” (Convene 30th Meetings Market Survey). https://www.pcma.org/sustainability-pulse-check-events/
- PwC (2024). “2024 Voice of the Consumer Survey.” https://www.pwc.com/gx/en/news-room/press-releases/2024/pwc-2024-voice-of-consumer-survey.html
- Splash (2024). “2024 Event Marketing Outlook.” https://splashthat.com/blog/event-marketing-2024-outlook
- Statista (2024). “Event Industry Market Size Worldwide, 2020 and 2028.” https://www.statista.com/statistics/694876/event-industry-market-size-worldwide/