Retailtainment is the operator discipline of designing a store so customers stay longer, remember it more sharply, and talk about it afterward. It is not decor, and it is not theater for its own sake. It is an economics play with three measurable payback mechanisms, and this guide covers what they are, how to budget against them at four realistic spend tiers, and how to know when yours is actually working.
What retailtainment actually is (and what it is not)
The word traces to sociologist George Ritzer’s 1999 book The McDonaldization of Society, which framed retailtainment as the use of sound, ambience, emotion, and activity to get customers interested in the merchandise and in the mood to buy. Most vendor content strips that definition to “add a photo op and call it experiential.” That misses the operator point. Retailtainment is not a consumer-facing gimmick. It is a discipline that changes the unit economics of a physical footprint, and the math only works if the install increases the time and money spent by customers who were already ready to buy.
Physical retail is not the dying channel the 2018-era coverage suggested. The National Retail Federation’s 2025 forecast puts 2024 total retail at $5.29 trillion, with $1.47 trillion in non-store and online sales. Roughly 72 percent of NRF-defined retail still happens in physical stores (the definition excludes autos, gas, and restaurants). Brick and mortar is the majority channel, and the operators who win the next cycle are the ones who treat the store itself as a content, community, and conversion asset rather than a warehouse with a register.
The mechanisms below are vertical-agnostic. Restaurants, salons, retail, hospitality, and entertainment operators share the same three payback levers. The tactics differ; the math does not.
The three mechanisms that make retailtainment pay (not four, not ten)
Vendor articles list ten benefits. Strip the prose and three remain. Each has a published input-output ratio you can forecast against.
Mechanism 1: dwell-time bias
Longer dwell produces more revenue, and the relationship is roughly linear across retail categories. The cleanest published elasticity comes from a 2007 industry study by David McAdams and Sharon Biggar, Time is Money, which found that a 1 percent increase in average dwell time corresponds to a 1.3 percent increase in sales. The study was published by Pathintelligence, a people-counting vendor, so it carries a commercial bias, but the ratio is the single most cited quantitative benchmark in retail analytics and the direction is consistent with Paco Underhill’s Why We Buy (Free Press, 1999, revised 2009), which introduced the field-observation methods behind most subsequent dwell research.
Plug your own numbers in. Take a 1,800-square-foot store doing $800,000 in annual revenue, with an average session of 8 minutes. A 1 percent bump in dwell (about 5 seconds of extra time per shopper) maps to $10,400 in incremental annual sales (1.3 percent of $800,000). A full additional minute, a 12.5 percent dwell increase, compounds to roughly $130,000 a year if the elasticity holds linearly at that scale. A Tier 1 retailtainment program costs under $500 a quarter. You do not need a flagship budget to make the math pencil.

The reason retailtainment moves this number is that most browsing is capped by an implicit social clock. Customers feel watched, feel they should not loiter, and leave before they would have on pure interest. Seating, a refreshment, an interactive element, or a staged demo all give the customer a socially acceptable reason to stay. In a January 2025 PYMNTS interview, Underhill put the design rule this way: spaces should “promote comfort and encourage longer visits.” Operators tend to design for efficient transactions. That is backwards for every retail format except a grocery aisle.
Mechanism 2: multi-sensory memory encoding
Scent, sound, taste, and touch are the channels competitors underuse. A website can show a video. It cannot smell, cannot play ambient music at the right tempo for the hour of day, and cannot put a cold drink in the customer’s hand. That asymmetry is the structural case for retailtainment.
The sharpest peer-reviewed finding is Alan Hirsch’s 1995 Las Vegas casino experiment, published in Psychology & Marketing, which found that slot-machine areas treated with a pleasant ambient fragrance saw a 45 percent increase in money gambled versus the weekends before and after, at p < 0.0001. A second, unodorized control area showed no change. The effect scaled with fragrance concentration: Saturday’s higher dose produced a 53 percent lift, Sunday’s lower dose a 34 percent lift. The study is 30 years old and single-venue, so treat the absolute magnitude cautiously, but the directional finding has survived every replication in scent-marketing literature.
Aradhna Krishna’s 2012 review in the Journal of Consumer Psychology synthesized 179 primary studies across the five senses and argued that multi-sensory environments work because they operate as subconscious triggers. Customers in a multi-sensory space generate brand attributes in their own heads (sophistication, quality, care) rather than receiving them from verbal marketing. Self-generated attributes are harder to argue with than a claim in a headline, which is why scent, music, and texture are consistently more efficient per dollar than additional signage.
You will see a figure cited across the vendor literature that “humans recall 35 percent of what they smell versus 5 percent of what they see,” usually attributed to Rockefeller University. The figure cannot be traced to any peer-reviewed paper or to any specific Rockefeller research team. Scent-marketing vendors repeat it. Academic olfaction researchers do not. Treat it as folklore and lean on Hirsch and Krishna for the science.
Mechanism 3: the halo effect
Edward Thorndike named the halo effect in 1920 after noticing that officers rating aviation cadets on independent traits produced correlations that were, in his own phrase, too high and too even. A strong overall impression bleeds into judgments on unrelated attributes. In retail, this is why the customer who enjoyed the store rates the product as higher quality, the staff as more expert, and the prices as fairer, holding those things constant.
The commercially measured version of the effect is the International Council of Shopping Centers’ three-part Halo Effect series. The first study, in 2018, found that opening a new physical store produced a 37 percent average gain in a retailer’s overall web traffic and a 27 percent gain in web-traffic share in that market, based on 804 openings and closings across 145 markets. The third study, in December 2023, quantified the revenue side from $848 billion in credit card transactions: opening a store boosted online sales in the surrounding trade area by 6.9 percent on average, and by 13.9 percent for emerging direct-to-consumer brands. Closing a store ran the movie backwards: online sales fell 11.5 percent on average, with drops of 32 percent for home stores and 26 percent for department stores.
Two operator implications follow. First, retailtainment investment is usually underbudgeted because the spreadsheet scores it against in-store sales alone. The correct scorecard also counts the increase in branded search volume, direct site traffic, and online orders attributable to the trade area after the activation opens. Second, and this is the finding that should reorder your capital plan, ICSC III found that Gen Z shops in store more than Millennials and Gen X, at a rate similar to Boomers. The “digital natives only shop online” narrative is wrong, and it is wrong on the segment with the longest runway.
The misconception nobody else corrects: foot traffic is not the goal
Every top-ranking article on this topic frames retailtainment as a foot-traffic tool. That framing is wrong and it drives wasted spend.
Foot traffic is a mid-funnel metric. The end metric is revenue per square foot per month, which decomposes to foot traffic × conversion rate × average transaction value × return-visit rate. Retailtainment that raises foot traffic while cutting conversion loses money despite the impressive door count. The clearest public case is Showfields, the Manhattan rotating-brand “most interesting store in the world.” Its NoHo flagship occupied 14,707 square feet over four floors, drew “over a million visitors,” and hosted custom experiences for more than 1,000 brands before closing in September 2023 and filing Chapter 11 the following month. The company’s own statement to vendors named the flagship model as the problem. Neighborhood Goods followed a similar trajectory at roughly the same time. Both were high-traffic destinations. Neither earned the gross margin per visitor to survive the rent.
The correct target is dwell-time-weighted intent traffic. A customer who stays 12 minutes and buys is worth twenty customers who stay 90 seconds and leave. Screen every retailtainment idea on one question: does this add dwell among purchase-intent customers, or does it add headcount from non-buyers? Only the first is a return. Installations that attract loiterers, families with no budget in a luxury-positioned store, or photo-op tourists who clog the aisles without ever opening their wallets are a cost. Treat them that way in the capex memo.
The budget ladder: what retailtainment looks like at $500, $5k, $50k, and $500k
Most operator content is written as if every reader has a flagship budget. They don’t. The three mechanisms are available at every tier. The tactics compress.
Tier 1: Sensory Layer
Sensory layer only. A well-chosen licensed playlist (roughly $17 to $35 a month on Mood Media’s Fundamentals or Signature plans or $17 to $24 a month on Pandora CloudCover, both licensed for commercial use). A single commercial scent diffuser (AromaTech’s Ambience Mini at $125, or the AroMini BT Plus at $295, plus a fragrance bottle from $29). One upholstered chair or bench in a dead corner to reset the social clock on browsing.
Operators running this stack typically see a modest dwell lift (a few percent to low double digits, depending on format) which, on the arithmetic above, is worth five figures a year for even a modest store. What you do not get at this tier: content generation, social sharing, or a halo-sized digital lift. You are buying baseline sensory competence, which is what most operators are missing anyway.
Tier 2: Content Fixture
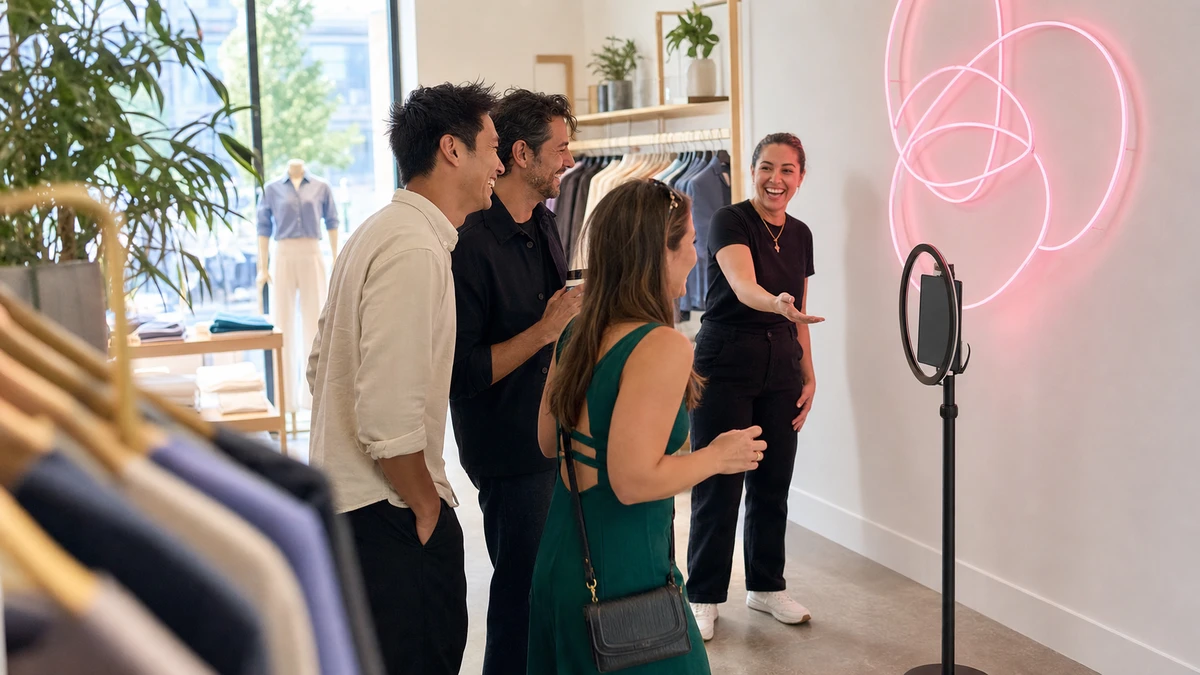
At this tier you add one content-generating fixture. A branded photo op with a reason to share, a self-serve customization station, a tasting bar, or a kids’ play zone, depending on vertical. The vertical choice is less important than the discipline: the customer should leave with a shareable artifact that carries your brand somewhere their friends will see it.
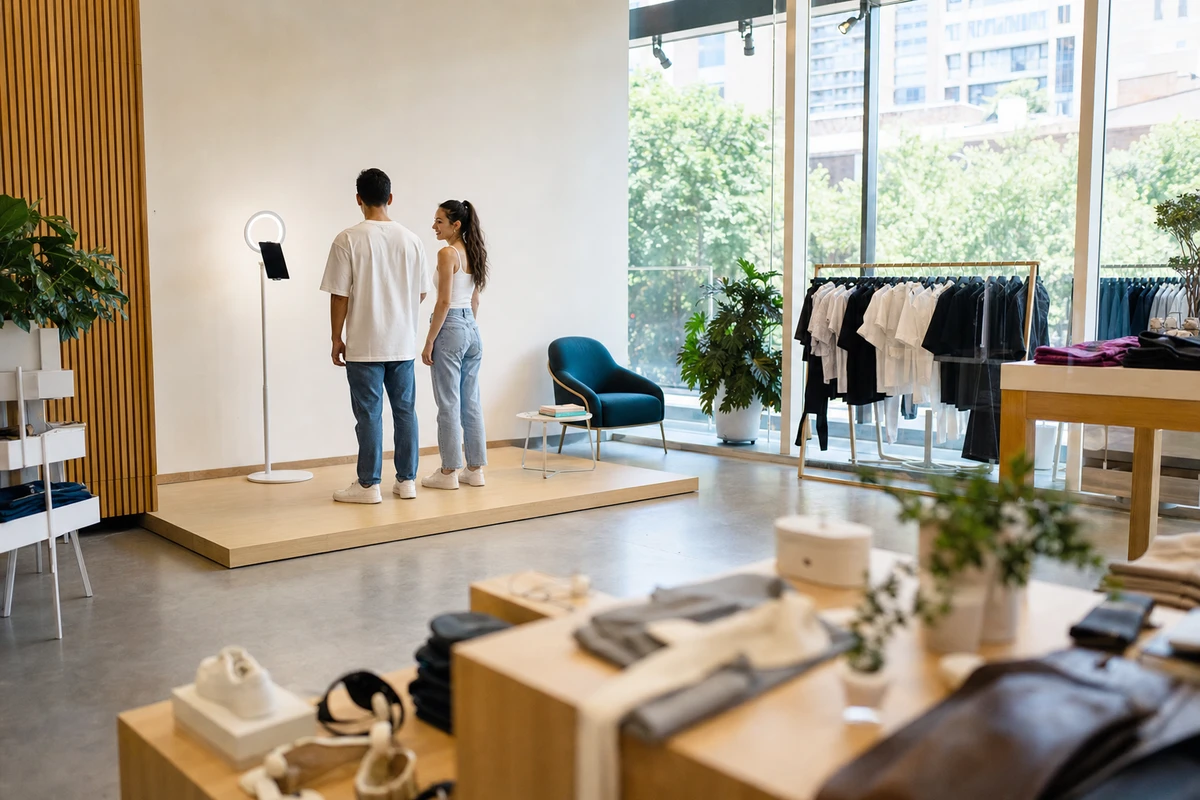
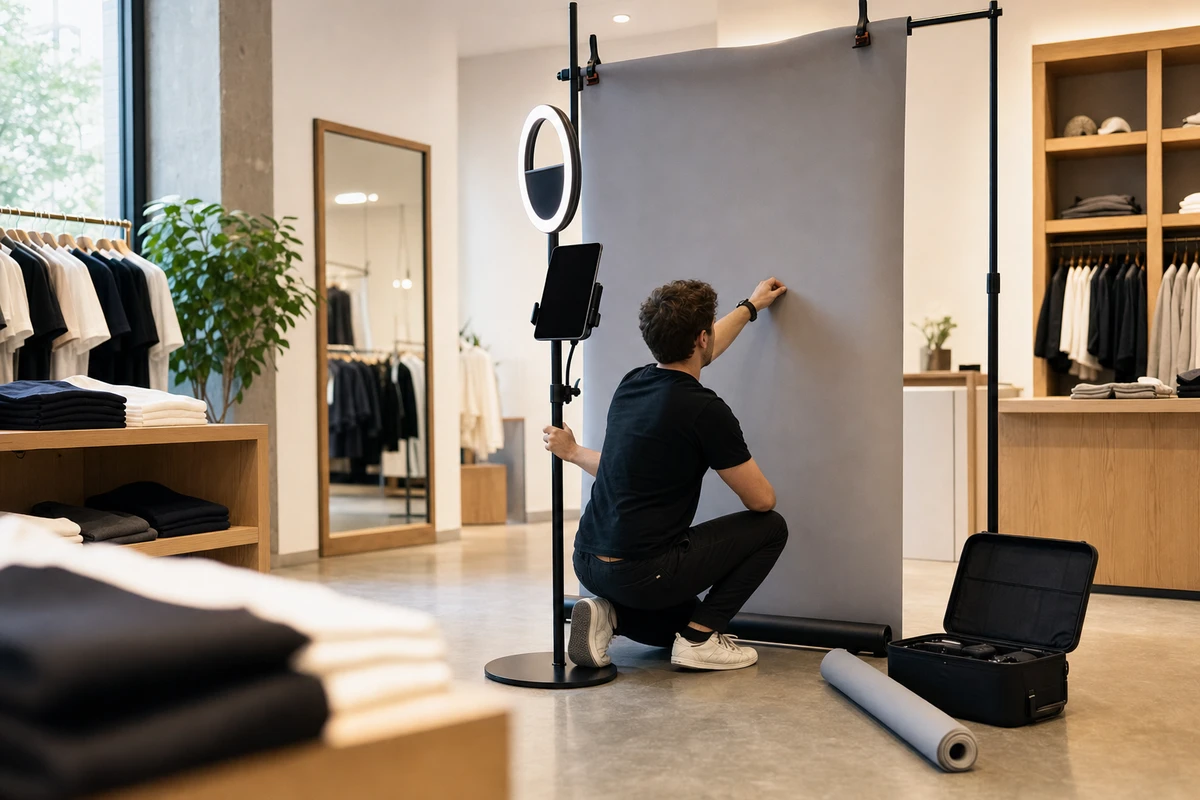
Simple Booth HALO is one example of that fixture category: a branded photo station that gives customers a reason to stay, share, and leave an opt-in without turning the store floor into a staffed event booth.

Add one recurring event a month. Loaded cost runs $400 to $1,200 per event (space, host, materials, small promo spend). The measurement targets at this tier are content shares, email capture at the fixture, and event RSVP-to-walk-in ratios, all of which track to pipeline rather than to feel-good foot traffic.
Benchmarks from published activations help calibrate. A BizBash March 2025 case study on a Jägermeister festival activation reported a 49 percent conversion rate on a paid product, 10,500 shots sold, and an 18 percent email capture rate, which the brand described as well above industry standard. A Visit Savannah mobile activation in the same piece reported a 9-minute average dwell per attendee. Use these as upper-bound benchmarks for a well-designed activation, not as promises. A restaurant photo corner will not match a music-festival bar, but the measurement discipline is the same.
Tier 3: In-Store Attraction
Here retailtainment graduates from fixture to attraction. A dedicated 200 to 400 square feet inside the store, digital signage, a staffed element, and POS integration so you can A/B zone-open days against zone-closed days by timestamp. The hiring decision matters as much as the build: a dedicated experience host during peak hours often produces more lift than another $10,000 of build cost.
Target a mid-single-digit conversion lift among customers who enter the zone; that is the range operators with this kind of instrumentation tend to hold to. Event Marketer’s EventTrack 2026 research found 61 percent of consumers are more inclined to purchase a brand’s product after an experiential event, and 85 percent of B2B attendees feel more educated about a product. Those are directional benchmarks for what a mid-tier activation should move.
Tier 4: Flagship Experience
This is the flagship: Nike House of Innovation, Apple Fifth Avenue, Lego Store, Starbucks Reserve Roastery. The store’s own P&L rarely justifies the build. The halo lift on the brand’s digital channels does, and it does so precisely to the extent that the ICSC data predicts. If you are not an enterprise multi-location operator, this tier is a cautionary benchmark, not a goal. The trap every independent operator falls into is scaling Tier 4 tactics to a Tier 2 budget, which produces theater that looks underfunded next to the real thing.
How to measure whether it’s working
The largest gap in existing retailtainment coverage is that nobody tells the reader how to know. Here is the instrumentation layer.
Dwell Time
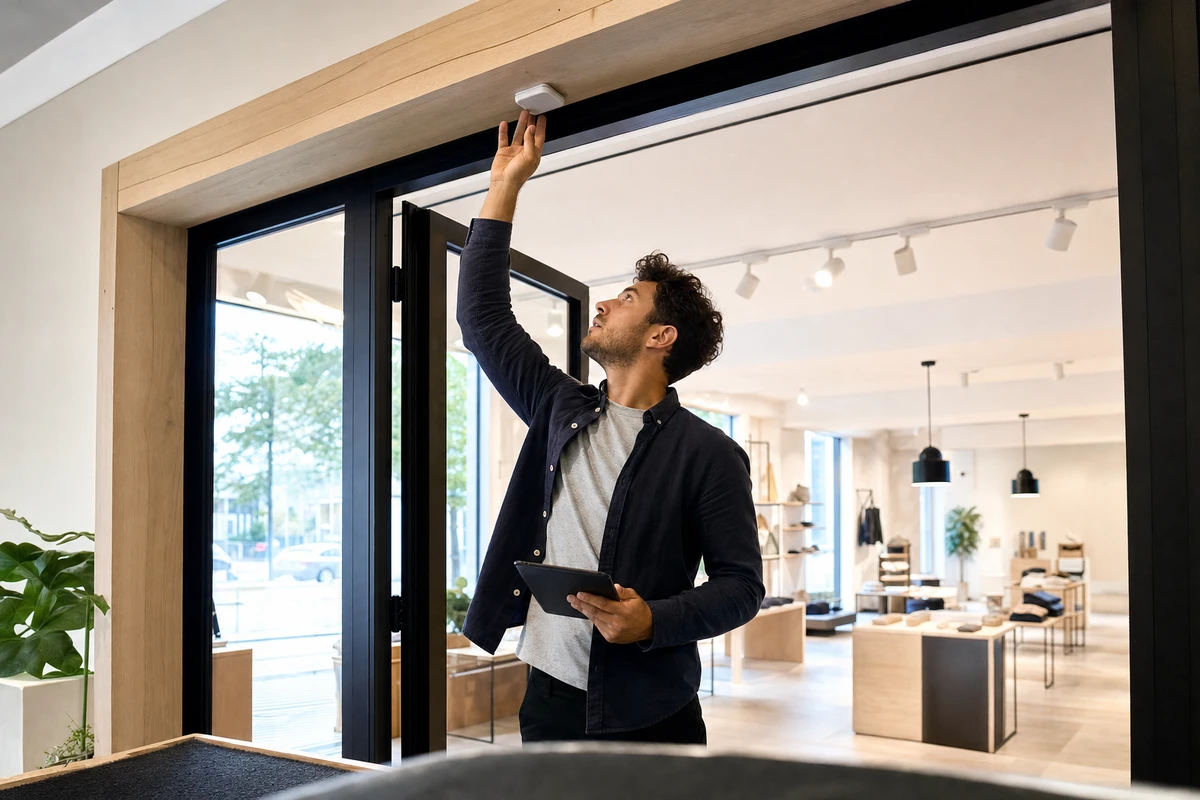
A two-sensor people-counter like Storetraffic’s Pearl pair runs $499.95 in hardware with a $40.95-a-month Retail plan that includes POS integration, which is the tier you want because it lets you join traffic to transactions. RetailNext and V-Count are enterprise-grade alternatives, both on custom quotes, typically starting at several hundred dollars a month per location. Baseline for 30 days before the install and compare to 30 days after.
Conversion Rate
Pair dwell with POS by timestamp. The pattern you want is dwell up, conversion flat or up. If dwell is up but conversion is flat or down, you are attracting the wrong traffic, which is the Showfields failure in miniature. Cut the install and try a different one.
Halo Lift
Watch branded-search volume in Google Trends for your local market, direct traffic to your site, and any email-list growth attributable to in-store capture. The ICSC studies give you a ballpark for what a reasonable lift looks like (single-digit percent on online sales in trade area, up to mid-teens for emerging brands).
Repeat-Visit Rate
A loyalty program, clienteling CRM, or even a stamp card will do. A memorable experience should compress the interval between visits and raise the 90-day revisit rate. If it doesn’t, the memory isn’t sticking.
Sentiment Signal
Unsolicited mentions of the in-store experience in Google reviews and Instagram tags. If three months in the experience is not showing up in reviews, it is wallpaper, not a differentiator. Cut or rebuild.
Three mistakes that kill retailtainment ROI
Adding Friction To The Purchase Path
A checkout lane narrowed by a photo installation loses more conversion than the installation earns in attention. The shortest route from door to register must stay the fastest path through the store. Put the theater on a detour, not on the main stage.
Staffing Theater With Unprepared Staff
If the experience requires staff interaction (demo, tasting, consultation), the staff must be trained, scripted, and compensated for it. A bored associate standing next to a $30,000 installation is worse than no installation, because the contrast telegraphs that the operator does not actually believe in the thing. Operator posts on r/smallbusiness describe this pattern repeatedly: experiential elements installed, staff resistant, program quietly dies.
Installing Permanent Fixtures For A Rotating Audience
A static experience wears out. The repeat-visit lift decays quickly if the content does not rotate. Budget for refresh, not just install. The rotation does not have to be expensive. A new monthly artist, a seasonal menu, a reskin of the photo-op backdrop is often enough. A returning customer should always find something they have not seen.
What to take away
Retailtainment is an operator discipline, not consumer theater. Three mechanisms carry the weight: dwell-time bias with its 1.3:1 sales elasticity, multi-sensory encoding with the cleanest evidence in scent studies like Hirsch 1995, and the halo effect that ICSC has quantified across three studies and a decade of shopping-center data. Each mechanism has a numeric anchor an operator can forecast against. Each is available at a $500 quarterly budget and at a $500,000 quarterly budget, with the tactics compressing accordingly. The operators who win the next cycle of physical retail are the ones who treat the store itself as the content, and who instrument the store well enough to tell when the content is working. Sources
- ICSC (2018). “ICSC ‘Halo Effect’ Study Finds Physical Stores Drive Increase in Online Traffic and Brand Awareness.” https://www.icsc.com/news-and-views/icsc-exchange/icsc-halo-effect-study-finds-physical-stores-drive-increase-in-online-traff
- ICSC (2023). “New ICSC Study, ‘The Halo Effect III: Where the Halo Shines,’ Quantifies How Physical Stores Drive Online Sales.” https://www.icsc.com/news-and-views/icsc-exchange/new-icsc-study-the-halo-effect-iii-where-the-halo-shines-quantifies-how-physical-stores-drive-online-sales
- Retail Sensing. “Retail Dwell Time Metric” (citing McAdams, D. & Biggar, S. (2007), Time is Money: Shoppers Buy More When They Stay Longer, Pathintelligence). https://www.retailsensing.com/people-counting/retail-dwell-time-metric/
- Hirsch, A. R. (1995). “Effects of Ambient Odors on Slot-Machine Usage in a Las Vegas Casino.” Psychology & Marketing, Vol. 12, Issue 7, pp. 585–594. https://onlinelibrary.wiley.com/doi/abs/10.1002/mar.4220120703
- Krishna, A. (2012). “An Integrative Review of Sensory Marketing: Engaging the Senses to Affect Perception, Judgment and Behavior.” Journal of Consumer Psychology, Vol. 22, Issue 3, pp. 332–351. https://www.sciencedirect.com/science/article/abs/pii/S1057740811000830
- Thorndike, E. L. (1920). “A Constant Error in Psychological Ratings.” Journal of Applied Psychology, Vol. 4, pp. 25–29. https://psycnet.apa.org/record/1920-10104-014
- National Retail Federation (2025). “NRF Forecasts 2025 Retail Sales to Hit $5.42 Trillion, Despite Economic Uncertainty.” https://nrf.com/media-center/press-releases/nrf-forecasts-2025-retail-sales-to-hit-5-42-trillion-despite-economic-uncertainty
- James, D. (2023). “Showfields Closes New York Store in Manhattan.” Retail Dive. https://www.retaildive.com/news/showfields-closes-manhattan-store/695041/
- Howland, D. (2024). “All Showfields Stores Close.” Retail Dive. https://www.retaildive.com/news/showfields-dtc-department-stores-closing/704453/
- Event Marketer (2026). “Exclusive Research: EventTrack 2026.” https://www.eventmarketer.com/article/exclusive-research-eventtrack-2026/
- Laufik, M. (2025). “Top 5 Ways Event Profs Measure the Success of Pop-Up Activations.” BizBash. https://www.bizbash.com/experiential-marketing/top-5-ways-event-profs-measure-the-success-of-pop-up-activations
- Storetraffic (2026). “People Counter Plans & Pricing.” https://storetraffic.com/people-counter-pricing/
- AromaTech (2026). “Scent Diffusers Collection.” https://aromatechscent.com/collections/scent-diffusers
- Mood Media (2026). “Subscription Music for Business Pricing.” https://us.moodmedia.com/shop/solutions/audio/music-for-business-pricing
- Pandora CloudCover (2026). “Pricing.” https://cloudcovermusic.com/pricing
- PYMNTS (2025). “Beyond Shopping: Malls Seek New Life as Dynamic Destinations” (interview with Paco Underhill). https://www.pymnts.com/news/2025/beyond-shopping-malls-seek-new-life-as-dynamic-destinations/
- Ritzer, G. (1999). The McDonaldization of Society. Pine Forge Press.
- Underhill, P. (1999, revised 2009). Why We Buy: The Science of Shopping. Free Press.