
A specialty retailer spends $4,000 on a Saturday activation: a branded photo station by the front window, a sampling table, a staffer handing out a limited weekend offer. The store stays busy all afternoon. Bags move, the register line doubles, the day feels like a win. By Monday the owner faces a question that is simpler to ask than to answer. Was the day busy, or was it worth it? Nobody can point to the number that proves it.
That gap has a name. Foot traffic attribution is the practice of tracing a physical store visit back to the specific activation or marketing touchpoint that caused it, then assigning that visit a dollar value. Search the phrase, though, and nearly every result describes one narrow version of it: a location-data product that matches phones to ads, sold to advertisers running large programmatic media budgets. An operator running an in-store activation does not need that product. The activation itself is the measurement instrument, and the method below fits a single Saturday and a four-figure budget.
What “foot traffic attribution” actually means (and the two definitions getting conflated)
The owner from the opening searches “foot traffic attribution” that afternoon and finds a wall of vendor pages that all say roughly the same thing. That is not a coincidence. Two different jobs share one phrase, and the confusion is doing real damage to operators trying to measure their own work.
The first definition is the ad-tech one
The first definition is the ad-tech one. Here, foot traffic attribution (also called footfall attribution or footfall measurement, the terms are used interchangeably in the industry, per AI Digital) means matching a digital ad impression on a mobile device to a later store visit detected by GPS. It is built for media buyers who need to prove that a connected-TV, mobile, or digital out-of-home campaign moved people into stores.
Operator Attribution
The second definition is the operator’s, and it is the subject of this article. It means identifying which activation or touchpoint drove a physical visit, and working out what that visit was worth. Same three words, completely different job. The operator is not asking “did my programmatic campaign drive incremental visits at scale.” The operator is asking “did the thing I ran this weekend work, and what did it return.”
The distinction matters because most in-store spending is still invisible to digital measurement. E-commerce was 16.4% of total US retail sales in 2025 (US Census Bureau), which means roughly 84 cents of every retail dollar still moves through a physical location. (A widely repeated claim puts the in-store figure at 90%; it traces to a 2016 location-vendor executive quote in AdExchanger and is best retired in favor of the current Census number.) On top of that, a 2024 ESW global survey of more than 18,000 shoppers found that 23% regularly research products online and then buy them in a physical store.
That visit gets credited to nothing, or to the last ad clicked, and the activation that actually pulled the customer in goes unmeasured. Foot traffic attribution, in the operator’s sense, is the discipline that closes that gap. It is a practice (capture, tag, compare), not a product to buy.
Why the location-data model isn’t built for operators
A shopper scrolls past a video ad on a phone in the morning and walks into a store three days later. A location-data platform is built to catch exactly that sequence, and it is worth understanding how before deciding whether to pay for it.
The mechanism is a device graph
The mechanism is a device graph. Ad-tech platforms collect GPS signals from people who opted into location sharing inside various mobile apps. When a device is shown a digital ad, the platform logs its ID. It then watches whether that same ID later appears inside a geofenced boundary drawn around the target location. A visit observed within the lookback window, commonly 7 to 30 days after the ad exposure, gets counted as an attributed visit. To separate real lift from background noise, the platform compares the exposed devices against a control group of similar devices that were not shown the ad (OnSpot Data).
It is a genuinely capable model for the job it was built for. The trouble is fit. Three problems make it the wrong instrument for an operator running an activation.
The panel is modeled, not complete
First, the panel is modeled, not complete. The device graph is extrapolated from whichever app users opted into location sharing, and that pool skews toward urban areas and higher-income demographics (OnSpot Data). OnSpot also notes that 35 to 40% of raw location signals are discarded for quality control, so the working sample is smaller than it appears. An operator in a suburban or working-class market is being measured against a panel that may not contain their customers.
The model attributes ad exposure to a visit
Second, the model attributes ad exposure to a visit. With no measurable digital ad spend, there is nothing for it to attribute. An operator who put the budget into a physical activation rather than a programmatic campaign has handed the model no input to work from.
It needs scale and time
Third, it needs scale and time. A stable lift figure requires enough ad exposures and enough observed visits to clear statistical noise, and a 30-day lookback window is built for always-on campaigns. A single Saturday activation is a rounding error inside that window.
None of this makes the location-data model bad. It makes it the wrong tool for this reader. And it points to the way out: an operator does not have to infer visits from strangers’ phones, because the operator controls the moment of contact.
The activation is the attribution instrument
Back at the Saturday activation, the staffer at the photo station is standing two feet from every visitor the owner wants to measure. That proximity is the whole argument.
Device-graph attribution exists because advertisers never meet the people
Device-graph attribution exists because advertisers never meet the people they are trying to count. They buy an impression, lose sight of the person, and reconstruct the visit afterward from phone data. An operator running an activation has the opposite situation. The visitor is physically present, engaged, and willing to interact. Attribution does not have to be reconstructed later. It can be built into the activation while the visitor is standing there.
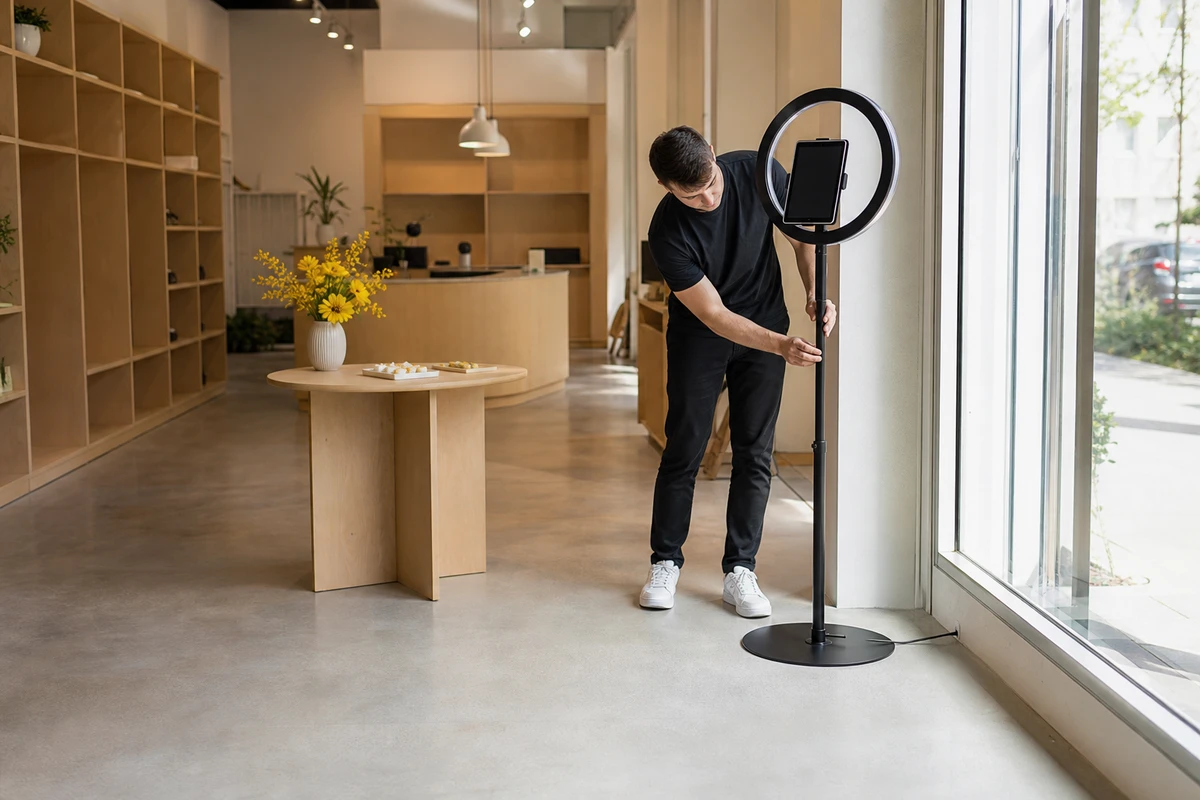
Three things are worth instrumenting at the moment of contact. The first is identity: an opt-in that turns an anonymous visitor into a known contact with a name and an email or phone number. The second is a trackable token: a unique code, a QR destination, or a scannable offer tied to that one activation and nothing else. The third is a timestamp: a record of when the visit happened, so it can later be matched against a baseline. The photo station from the opening is one practical instrument for the first of these: a visitor steps up for a photo, enters a name and email to have the image sent over, and an anonymous face becomes a known contact. Simple Booth’s HALO kit captures that opt-in through custom lead-capture fields as the photo is delivered, the same mechanism the entertainment-venue chain Treetop Golf used to build a list of 150,000 unique email addresses across its locations.

Captured this way, the data beats the device graph on every axis that matters to this reader. It is deterministic rather than modeled, a real person who opted in instead of a statistical estimate. It is consented. It is owned by the operator rather than rented from a vendor. And it keeps working after the activation ends, because a known contact can be followed all the way through to a later purchase. The activation stops being an event that merely happened and becomes a measurement instrument the operator built and controls.
Four attribution methods an operator can actually run
Most operators already attribute foot traffic without calling it that. They print “FB15” on one offer and “IG15” on another to see which redeems more, tape a QR code to the window, and ask the question at the register. The instinct is right. It just needs to be organized into methods with known strengths and known blind spots. Here are four, simplest to most rigorous.

The direct-response token is the simplest
The direct-response token is the simplest. A unique promo code, QR destination, or scannable offer is issued only at the activation, so every redemption traces cleanly back to it. The blind spot is everyone who was influenced but never redeemed: the customer who comes back two weeks later at full price and never mentions the code. A token undercounts, but what it counts, it counts honestly.
The point-of-sale survey, usually phrased as “how did you hear about us,” asks every visitor or buyer directly. Its strength is reach into channels digital tracking cannot see: signage, word of mouth, the activation itself. Its weakness is memory. Responses suffer from recency bias, where customers credit the last touchpoint they remember, and from availability bias, where ambient channels like signage get under-reported because they never felt like a deliberate choice (Kayyem Marketing). The method works best for considered visits where the customer made a deliberate trip, which describes most activation attendees.
The test-versus-control comparison measures an activation location or period against a matched one without the activation. A two-location operator runs the activation in one store and uses the other as a control. A single-location operator compares the activation period against matched prior periods, holding day of week and season constant. This is the first method that isolates lift rather than counting redemptions.
The holdout, or incrementality test, is the most rigorous and the least used. It deliberately withholds the activation from one comparable location or segment and measures the gap that opens up. It gives the cleanest read on what the activation actually caused, and it costs something real: the operator has to forgo running the activation somewhere it might have worked. That trade is why few operators run holdouts, and why the ones who do can defend their numbers.
No single method is enough
No single method is enough. A token undercounts, a survey misremembers, a comparison can be skewed by a bad control. Running a token, a survey, and a baseline comparison together lets each one cover what the others miss.
Counting heads is not ROI: the baseline problem
Six hundred people came through the door during the activation. The instinct is to call that the result. It is not. A foot-traffic count is an activity metric. It measures what happened, not what the activation caused.
The number that matters is incremental traffic: visits that happened because of the activation and would not have happened otherwise. ROI needs a counterfactual, an honest estimate of what foot traffic would have been with no activation at all. Every customer who would have walked in regardless is part of the baseline. Crediting them to the activation spend is not measurement, it is flattery.
This is where naive counts inflate. Several things lift a raw headcount with no help from the activation: the day of the week, the season, the weather, an unrelated event down the street, a concurrent promotion, paid media running in the same window. Shopify’s retail guidance names weather and seasonality specifically as factors that distort foot-traffic counts, which is why comparing a November activation against a January baseline conflates a seasonal swing with an activation effect. The fix is a single rule. Every visit claimed for the activation has to be measured as incremental against a baseline, whether that baseline is a set of comparable prior periods, a control location, or a deliberate holdout.
The attribution math: a worked ROI model
Take the $4,000 Saturday activation and run the full chain, one figure at a time.
Start with raw traffic
Start with raw traffic. The activation window drew 600 visitors. A comparable non-activation Saturday, matched for season and weather, drew 420. The baseline does the heavy lifting here: incremental visitors are 600 minus 420, or 180. The activation is credited with 180 visits, not 600.
Now convert
Now convert. Specialty retail runs an in-store conversion rate of roughly 15 to 30% (TruRating). Using the midpoint of about 22%, the 180 incremental visitors produce roughly 40 same-day buyers. At an average transaction value of $95, that is $3,800 in same-day attributed revenue, already most of the way to covering the $4,000 cost.
Then capture
Then capture. Suppose the photo station collects an opt-in from 40% of the incremental visitors. (Opt-in rate is an operator-set assumption, not an industry benchmark; it should be measured on the day, not borrowed.) That is 72 known contacts. If follow-up converts a quarter of them over the next three months, that is 18 more buyers at $95, or $1,710.
Total attributed revenue is $3,800 plus $1,710, or $5,510 against $4,000 of cost. Net return is $1,510, a ratio of about 1.4 to 1. The break-even point is the line that turns the activation into a decision rather than a feeling: at $95 per sale, the activation needed about 42 incremental buyers to cover its cost, and it produced 58.
Now run the same activation the wrong way. Skip the baseline. Credit all 600 visitors to the activation instead of the 180 incremental ones, convert at the same 22%, and that produces 132 same-day buyers at $95, or $12,540. The honest same-day figure was $3,800. Same day, same store, same activation: the only thing that changed is the dropped baseline subtraction, and it more than tripled the result. A figure like that would justify spending more on a weaker activation.
Captured contacts also let an operator measure what an activation earns beyond the first visit. Part of that longer-run return is experiential. A 2024 Raydiant consumer survey, cited in Fast Company, found that 52% of consumers name a positive in-store experience as the main reason they return, and a memorable activation is one way to create that experience. Travel-accessories brand BÉIS reported figures consistent with that pattern from a pop-up activation: a 30% lift in foot traffic, and customers acquired through the activation showing 20% higher 12-month value than the brand’s baseline cohort (Shopify). A disciplined model carries that forward by following captured contacts into their second and third purchases, as long as every assumption stays labeled.

What attribution still can’t tell an operator
Even with the math done, the operator who ran the activation watched plenty of people laugh at the photo station and walk out without buying or opting in. Some of them will be back. None of them are in the model.
This is the honest limit competitors tend to hedge
This is the honest limit competitors tend to hedge around. Attribution is a signal, not a verdict. A well-run model still misses several real returns: the brand and recall lift among visitors who did nothing measurable that day, the word of mouth an attendee starts at dinner that night, the delayed visit that lands outside the measurement window, and the multi-touch case where the activation was one nudge among several. These are not rounding errors. They are the reason a defensible model tends to understate an activation’s true return rather than overstate it.
The professional response is not to invent precision. It is to report a range and show the work. Instead of “the activation returned $5,510,” a single number that invites a CFO or a franchise owner to attack the weakest assumption, an operator reports something closer to “$4,800 to $6,200 in measured return, based on a 420-visit baseline, a 40% capture rate, and a one-quarter follow-up window, with brand and word-of-mouth effects excluded.” Stating the baseline source, the capture rate, and the attribution window alongside the result is what lets the figure survive scrutiny.

That is the real goal. Not a perfect number, which does not exist, but a number honest enough to drive the next decision: run the activation again, run it bigger, or stop. An operator who measures incremental traffic, captures identity at the moment of contact, and reports a range with its assumptions attached will out-argue the operator holding a confident single number every time, and will be the one who gets the next activation budget approved.
Sources
- U.S. Census Bureau (2026). “Quarterly Retail E-Commerce Sales, Q4 2025.” https://www.census.gov/retail/index.html
- AI Digital (2024). “Foot Traffic Attribution in 2024: A Full Breakdown.” https://aidigital.agency/foot-traffic-attribution/
- OnSpot Data. “A Guide to Foot Traffic Attribution.” https://www.onspot.com/blog/foot-traffic-attribution/
- AdExchanger (2016). “It’s Still All About Offline Retail, But Online Brings The Data.” https://adexchanger.com/data-exchanges/its-still-all-about-offline-retail-but-online-brings-the-data/
- ESW (2024). “Global Voices: Ecommerce Consumer Survey.” https://eswglobal.com/resources/global-voices-survey/
- Kayyem Marketing. “How Did You Hear About Us? A Complete Guide.” https://kayyemmarketing.com/how-did-you-hear-about-us/
- TruRating (2026). “What Is a Good Retail Conversion Rate?” https://www.trurating.com/resources/retail-conversion-rate/
- Shopify. “How to Open a Pop-Up Shop: Ideas, Costs, and Examples.” https://www.shopify.com/retail/pop-up-shop
- Fast Company (2024). “State of the In-Store Consumer” (Raydiant survey). https://www.fastcompany.com/