

A marketing director at a twelve-store home-goods chain opens next year’s budget spreadsheet with one line of direction from the CEO: do something experiential. She searches for what that costs. The first result quotes $90,000 for a trade-show booth. The second tells her events should claim 17% of the marketing budget. One number is too big and too specific; the other is too vague to enter into a cell. Neither tells her what to fund.
That gap is where most mid-market marketers sit when they build an experiential marketing budget. The honest answer to “how much” is a range. Experiential and events tend to claim somewhere between 9% and 17% of the marketing budget, and a brand with physical locations and a foot-traffic goal belongs near the top of that band. But the percentage is the easy part. The decision that sets the real number is whether that money buys a single rented activation or a recurring asset the brand owns and runs at the locations it already operates.
What follows is a method, not a price list. It builds the number from the ground up: revenue sets the marketing budget, the marketing budget yields an experiential slice, and one decision (whether that slice buys a rented activation or an owned asset) settles what the money actually does.
Why mid-market brands can’t borrow the experiential budgets they find online
Picture a regional fitness brand: eighteen clubs, a marketing team of four, and no one whose job is experiential. When that team searches for budget guidance, every useful-looking number is built for a company that looks nothing like theirs. That mismatch is the real problem, and it has a specific shape.
Mid-market here means a brand with roughly $10M to $250M in annual revenue, usually several to several dozen locations, a lean marketing team, and no standing experiential department. The budget advice online is written for two other readers, and neither one is this one.
The Cost Menu
The first kind of advice comes from experiential marketing agencies, and it arrives as a cost menu. Air Fresh Marketing’s published templates price a four-week in-store sampling program across 50 locations at $69,250 to $98,750, a 20-by-20 trade-show booth at a major show at $90,900 to $180,900, and a ten-city, eight-week experiential tour at $291,500 to $330,000. Those numbers are not wrong. They are priced for an enterprise brand running a national footprint with an agency executing everything. A mid-market brand reading them learns the cost of a program it was never going to run.
The second kind comes from general marketing-budget guides
The second kind comes from general marketing-budget guides. They give a clean percentage for total marketing spend, and some isolate an events line, but they stop short of telling a mid-market marketer how to size the experiential slice specifically. The reader is left between a number that is too big and a number that is too vague.
This gap costs more than confusion. Skift Meetings, writing in November 2025, named the belief directly: experiential marketing is “often associated with jaw-dropping installations, celebrity appearances, and multimillion-dollar budgets.” Mid-market marketers see those examples, conclude the category is not for them, and self-select out of a channel they could afford. The fix is not a smaller version of the enterprise budget. It is a different way of sizing the number.
Work down from revenue: sizing the experiential slice
The marketing director from the opening still has an empty spreadsheet cell. Filling it is an arithmetic problem with three steps, and each step has a benchmark.
Step one is revenue to marketing budget. Gartner’s CMO Spend Survey for 2024 found marketing budgets averaging 7.7% of company revenue across all company sizes. Smaller companies tend to allocate a higher share: Gartner data for companies under $500M in revenue has run closer to 8.6%. Mid-market brands still building brand position, rather than maintaining an established one, often commit toward the upper end of that range.
Step two is marketing budget to experiential slice. Here the published figures conflict, and the conflict is worth understanding rather than averaging away. Gartner data reported by HubSpot in 2025 puts the all-company average for event marketing at 17.1% of the marketing budget. American Express Global Business Travel’s 2024 Meetings and Events Forecast puts it closer to 14%. Gartner data for companies under $500M in revenue, reported by Banzai in 2022, came in lower, at 9.4%. The figures differ because they measure different company sizes in different years, and the band most mid-market brands fall in is the lower one. Agency blogs often cite a wider 10% to 30% rule of thumb, but that range is not traceable to primary research; the measured numbers sit between roughly 9% and 17%.
Step three adjusts for fit
Step three adjusts for fit. A brand with physical locations, foot traffic, and a goal of capturing customer data or repeat visits belongs near the top of the 9-to-17 band. A pure-digital or commodity brand belongs near the bottom.
Here is the cascade with numbers
Here is the cascade with numbers. Take a multi-location brand with $50M in annual revenue. At 8% of revenue, its marketing budget is $4M. As a physical-location brand with a foot-traffic goal, it sits near the top of the experiential band, at 15%, which puts the experiential slice at $600,000. The formula behind that is short: annual revenue, times the marketing-budget percentage, times the experiential share, equals the slice. The same brand with a purely digital model and a 10% share would land at $400,000 instead. The arithmetic is not the hard part. The next decision is.
The decision that sets the real number: owned asset vs. rented activation
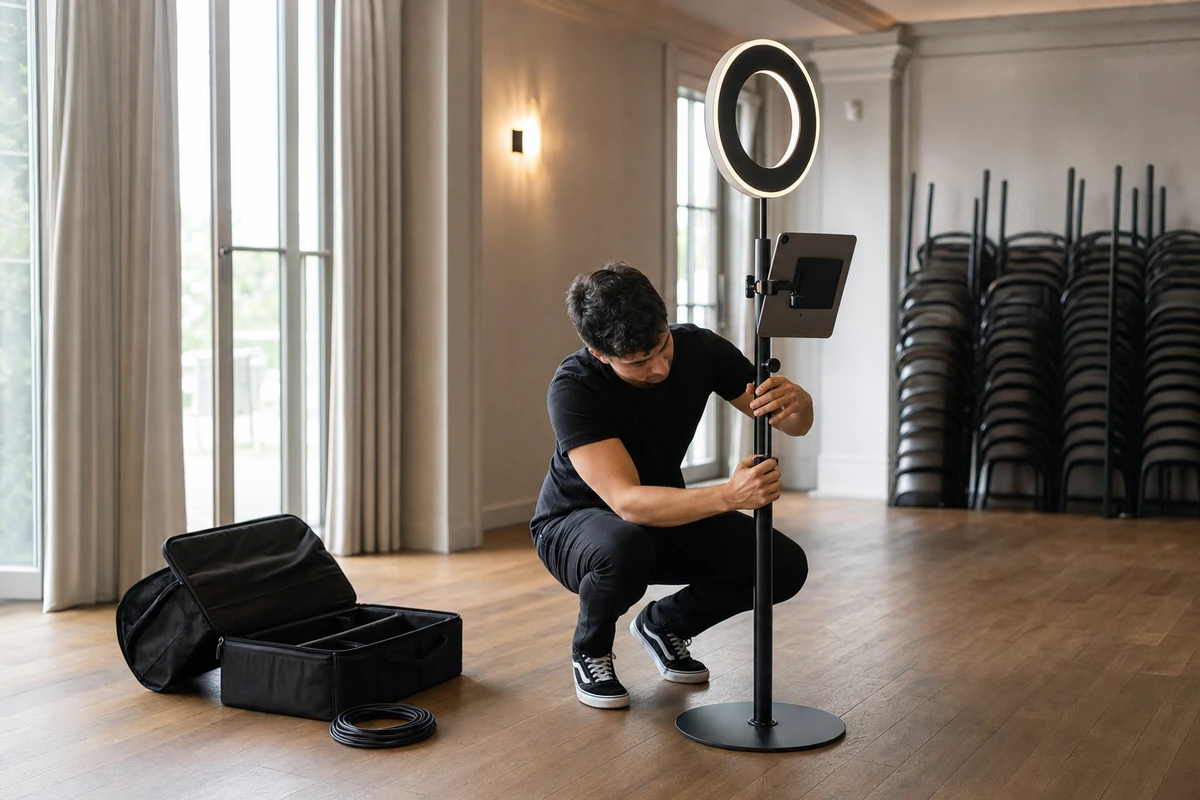
Two mid-market brands each have a $600,000 experiential slice. The first spends it on one large rented activation: an agency designs a pop-up, builds a custom structure, staffs it, runs it for a few weeks, and strikes the set. The second spends it on equipment and software it will own, a branded photo-and-content experience it can run at its own locations on a schedule, month after month. Same budget, two completely different programs, and the entire field of search results for experiential budgeting assumes only the first one exists.

The two models behave differently as line items
The two models behave differently as line items. A rented, agency-produced activation carries a high cost per event, leaves no asset behind, and resets the spend to zero for the next one. That is the right choice for a genuine one-time need: a product launch, a festival presence, a test in a market the brand does not yet operate in. An owned recurring program is a capital outlay for a repeatable asset, followed by a low marginal cost each time it runs. The asset amortizes, and the cost per touchpoint falls every time the program runs again.
The mechanism behind the difference is specific, and it favors mid-market brands in a way enterprise advice never mentions. Look at where the money goes in Air Fresh’s ten-city tour template. Two of the largest line items are venue and permit costs across the ten cities, and travel and lodging for the touring staff. A multi-location brand running an owned program at its own locations pays close to nothing for the first and very little for the second. It already controls the thing an enterprise tour budget spends the most to rent: physical space with built-in foot traffic. A rented activation pays to borrow an audience. An owned program activates an audience the brand already has walking through the door.
This is not an argument that owned always wins. A brand testing a new market has no locations there to use, and the rented model is correct. Owned carries its own quality bar: ALT TERRAIN, itself an experiential agency, warns that “one extraordinary activation in one city, executed with the right budget and the right team, will consistently generate more ROI than five mediocre ones spread thin.” A recurring program run carelessly across a dozen locations is the mediocrity that warning describes. The owned-versus-rented call is a fit decision. But for a multi-location mid-market brand that runs the program well, owned is the option the search results ignore. Skift Meetings makes the same case from the budget-constraint side, naming “owned venues like your retail space, office lobby” as assets most brands underuse, and owned is usually the choice that makes the budget defensible year after year.
Allocating across the five cost categories
An agency proposal often lands with a third of the budget assigned to custom fabrication for a structure that will be used once. That is the first place a mid-market budget leaks: into the parts of an activation that photograph well and away from the parts that prove it worked.
A workable category split exists. Air Fresh Marketing publishes a five-category model: staffing and talent at 25% to 40% of the budget, production and fabrication at 20% to 35%, logistics and operations at 15% to 25%, product and sampling at 5% to 15%, and measurement and technology at 5% to 10%. Those ranges come from an agency, not an independent body, so they are a starting structure rather than a law.
The mid-market correction is to know what to under-fund and what to protect. Under-fund the things priced for enterprise scale: one-off custom fabrication, celebrity or influencer talent, national geographic spread, and full-service agency fees. An owned program quietly removes much of the production and logistics weight, because the asset is reused and the venues are already the brand’s own.
Protect two lines
Protect two lines. The first is the asset itself, if the brand goes owned, because that is the line that produces the recurring savings. The second is measurement, the 5% to 10% category most teams cut first. Cutting it is the costliest mistake in the budget. Measurement gets cut first for a simple reason: it is the only category that produces nothing visible at the event itself. There is no structure to photograph, no staff on the floor, no product in a guest’s hand. It looks optional right up until the budget review, when its absence is the reason the program cannot prove it worked.
Measurement is the line that converts the other 90% from an expense into a defensible investment. ALT TERRAIN puts it plainly: measurement “determines whether your experiential budget survives the next planning cycle.” Air Fresh frames the mechanism: measurement is what proves return and “secures future budget increases.” For a mid-market brand, the concrete output of that measurement line is first-party data, the opted-in email and text contacts captured at the experience, because a brand cannot win the next budget cycle on photographs of a happy crowd.
Budget by cost per engagement, not cost per event
A $90,000 activation and a $30,000 activation tell a marketer almost nothing when set side by side. The number that carries information is cost per engagement: the all-in program cost divided by the count of customers who actually interacted.
This is not a new idea. PortMA, an independent marketing measurement firm, benchmarks experiential programs by cost per activation day. Its largest public dataset, 24,606 wine-sampling event days, shows an average all-in cost of $291 a day and a median of $439, with the range running from $171 a day at the low quintile to $900 at the high one. PortMA segments these benchmarks by product category, so the wine-sampling figures are an anchor rather than an exact comparator for every program. Even so, they are the largest independent cost dataset published in the category, and a program priced inside that band has real data on its side. A program well outside it needs an explanation.
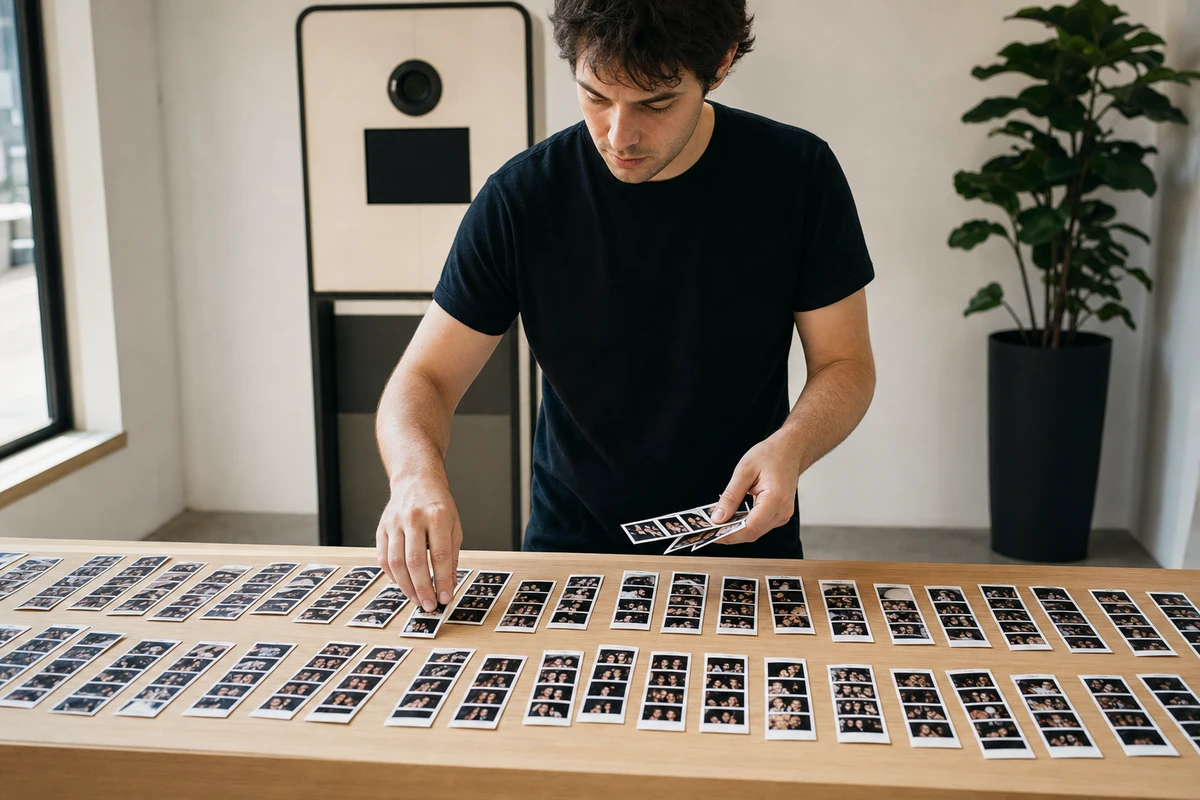
The method applies cleanly to an owned program. Take a multi-location brand running a branded photo-and-content experience at six of its locations, twice a month at each. That is 144 event-days a year. If each event-day draws 60 to 65 guests who interact with it, the program produces roughly 9,000 guest engagements annually.
Now the budget
Now the budget. The capture hardware is a one-time purchase. Commercial-grade interactive capture equipment runs roughly $2,000 to $10,000 a unit by general market estimates, not a figure traceable to an independent benchmark, so six mid-range stations land near $24,000 as a capital outlay. The recurring annual cost (software, a creative refresh, incremental hours for staff already on site, and measurement) comes to roughly $36,000. Year one costs about $60,000; each year after, about $36,000.
The cost per engagement falls out of that. Year one is $60,000 across 9,000 engagements, about $6.70 each. Every year after is $36,000 across 9,000, exactly $4.00 each. Measured PortMA’s way, that is $417 per activation day in year one and $250 after, both inside the wine-sampling benchmark band. That places the program’s per-day cost within range of independent data, not only an agency quote.
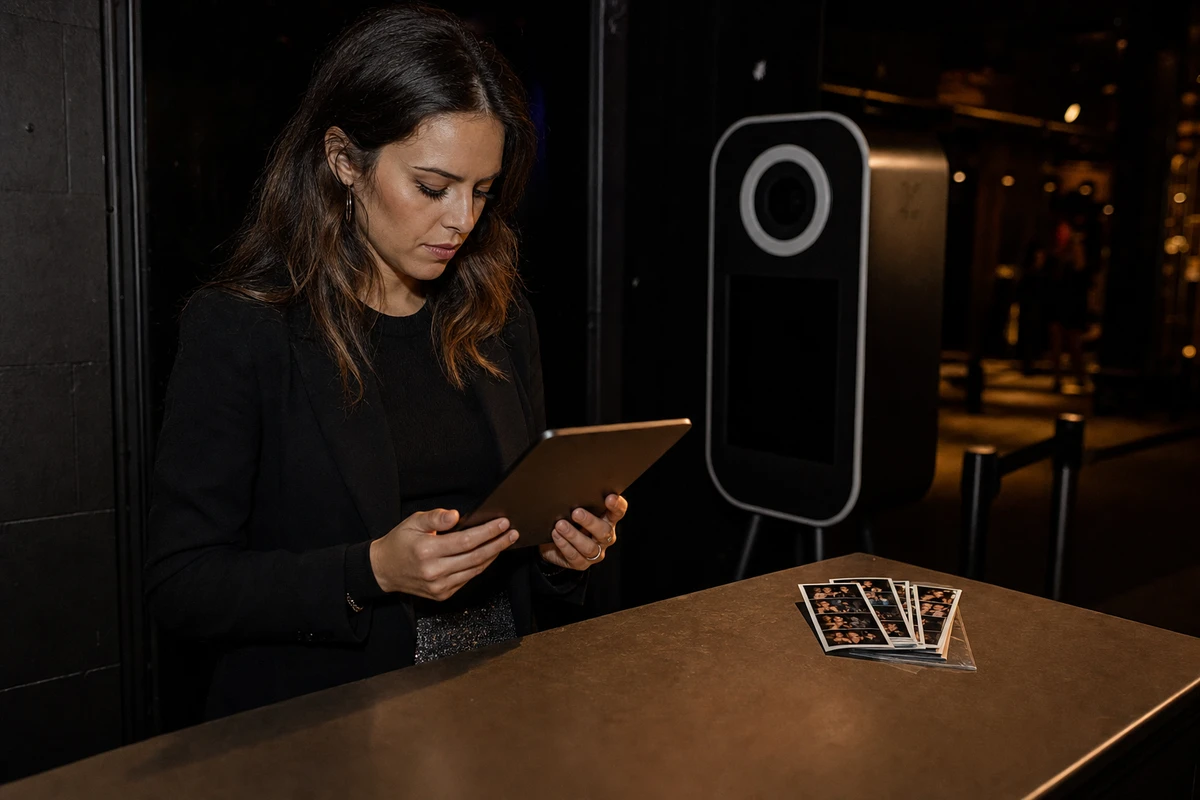
Carry the math one step into pipeline. If 40% of 9,000 engagements opt in to email or text, that is 3,600 captured contacts a year. At a conservative, illustrative $50 of lifetime value per contact (an assumption here, not a sourced benchmark), that points to roughly $180,000 in pipeline value against a $36,000 recurring cost. Those opt-in figures are illustrative, but the capture behind them is something multi-location brands already run: the entertainment chain Treetop Golf built 150,000 unique email addresses across its locations using the lead-capture fields in Simple Booth’s HALO kit, an iPad photo station where a guest enters an email or phone number to receive the shot they just took.
The rented alternative shows why the owned model compounds. A single rented in-store activation runs $69,000 to $99,000 by Air Fresh’s published templates. It may well out-draw the owned program during its run. What it cannot do is run again next month without being paid for again. Three years of one rented activation a year costs around $255,000. Three years of the owned program costs $60,000 plus $36,000 plus $36,000, or $132,000, and the brand still owns the hardware at the end. The denominator in cost per engagement keeps growing while the hardware cost never repeats.
One number belongs in the finance conversation: cost per captured contact. In the owned example, $36,000 divided by 3,600 contacts is $10 a contact. Set that beside the brand’s digital customer-acquisition cost, and the experiential line stops being a marketing expense and becomes a comparison finance can read.
Protecting the budget: contingency, hidden costs, and the finance case
The quote came in at $80,000. The final invoice was $94,000. The difference was not waste; it was the set of costs experiential first-timers do not see coming.
The list is consistent across agency sources. Rush permits run two to three times standard rates. Power and internet drops at a venue cost $500 to $2,000 or more. Overtime runs staffing costs up 1.5 to 2 times. Storage between events costs $200 to $1,000 a month. Rushed freight runs three to five times standard shipping. Where a program runs changes the total too: ALT TERRAIN reports the same activation can cost 40% to 80% more in New York City than in a secondary market, and that high-profile NYC locations can need six to eight weeks of permit lead time across multiple agencies.
This is why the contingency line, an industry norm of 10% to 15%, is not optional padding for a mid-market brand. Improvado estimates hidden costs consume 15% to 30% of marketing budgets generally. A mid-market team has less slack than an enterprise to absorb an overrun, so the contingency reserve is the difference between a program that finishes the year and one that gets cut in the third quarter. An owned program carries a quieter risk profile here, because most of these line items belong to one-off rented events, but it is not immune, and the reserve still belongs in the budget.
Then comes the budget review, where experiential dies if it is defended in marketing language. Chief Marketer put the translation bluntly in December 2025: “Stop saying: ‘We need budget for events.’ Say instead: ‘Events are forecasted to deliver qualified pipeline.‘” A CFO running a zero-based review asks one question first, as Snapsight frames it: what did last year’s spend return. The answer has to be in their units. Snapsight lists the five questions finance actually asks of an event budget: did it produce qualified leads, reveal market intelligence, strengthen customer relationships, generate reusable content, and outperform the alternatives.
Three moves make that case
Three moves make that case. Lead with cost per captured contact against customer-acquisition cost, the comparison built in the previous section. Count the content: Snapsight notes that an event producing 30 reusable assets that would cost $50,000 to create separately represents $50,000 of value finance can see. And present good, better, and best scenarios rather than a single ask, naming in advance the metric that would trigger scaling the program up or cutting it. Improvado’s reallocation rule is a usable template: when customer-acquisition cost climbs more than 25% for two consecutive months, money moves. A budget that names its own kill switch is the one a zero-based reviewer trusts.
One caution belongs here, because it is the most common way the return disappears. Chief Marketer quotes a marketing leader on it directly: the biggest mistake is “teams spending heavily on events without the systems to capture or follow up on the leads.” The capture-and-follow-up system is not an add-on to the experiential budget. It is the part that turns the spend into pipeline, which is the entire reason the measurement line was protected.
The method, in one breath: size the slice from revenue, decide owned versus rented before anything else, protect the measurement line, budget by cost per engagement, and defend the number in finance’s language. The one move the search results never name is the one that matters most for a brand with its own locations. The smartest experiential budget is usually not the largest activation a brand can afford to run once. It is the smallest recurring asset it can afford to run forever.
Sources
- Gartner (2024). “Gartner CMO Survey Reveals Marketing Budgets Have Dropped to 7.7% of Overall Company Revenue in 2024.” https://www.gartner.com/en/newsroom/press-releases/2024-05-13-gartner-cmo-survey-reveals-marketing-budgets-have-dropped-to-seven-point-seven-percent-of-overall-company-revenue-in-2024
- HubSpot (2025). “Designing an Event Marketing Budget? Here’s What Experts Recommend.” https://blog.hubspot.com/marketing/event-marketing-budget
- American Express Global Business Travel (2024). “Meetings & Events Forecast 2024.” https://explorer.amexglobalbusinesstravel.com/Meetings-Events-Forecast-2024.html
- Banzai (2022). “How Much of My Marketing Budget Should be Dedicated to Events?” https://www.banzai.io/blog/how-much-of-marketing-budget-to-events
- PortMA (Portland Marketing Analytics). “Experiential Marketing Budget Benchmarks.” https://portma.com/resources/welcome-to-portma-academy/experiential-marketing-budget-benchmarks/
- Skift Meetings (2025). “Experiential Event Marketing on a Budget: Creative Wins that Work.” https://meetings.skift.com/2025/11/04/experiential-event-marketing-on-a-budget/
- ALT TERRAIN. “Experiential Marketing Costs: Your Budget Planning Guide.” https://altterrain.com/what-drives-experiential-marketing-costs/
- Air Fresh Marketing (2026). “How to Create an Experiential Marketing Budget That Maximizes ROI.” https://www.airfreshmarketing.com/blog/experiential-marketing-budget-maximize-roi
- Chief Marketer (2025). “Want More Dollars This Budget Season? Speak Finance, Not Marketing.” https://www.chiefmarketer.com/want-more-dollars-this-budget-season-speak-finance-not-marketing/
- Snapsight (2026). “Event Budget Justification: How to Prove Conference ROI to CFOs.” https://web.snapsight.com/blog/event-budget-justification-cfo-guide/
- Improvado (2026). “Marketing Budget Allocation in 2026: A Data-Driven Framework for Maximum ROI.” https://improvado.io/blog/marketing-budget-allocation